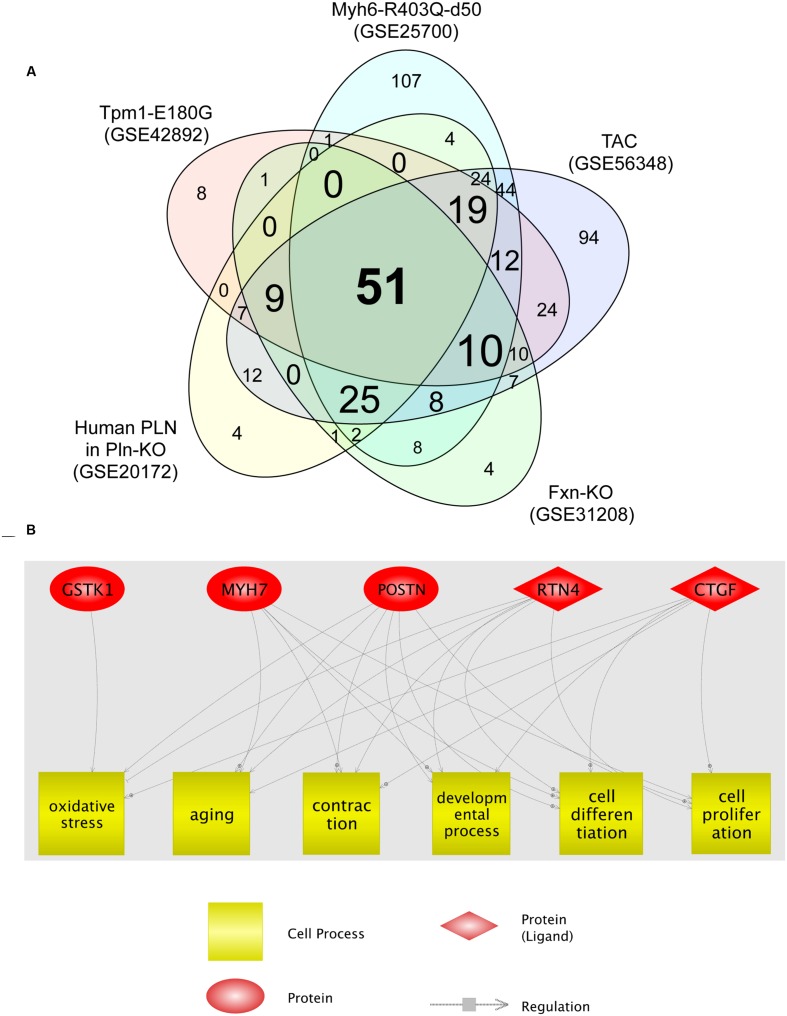
FIGURE 2.
Cell processes related to the five genes dysregulated in all five HCM transcriptome datasets. (A) Venn diagram of cellular processes significantly enriched for differentially expressed genes identified in each HCM transcriptome dataset. The numbers of cellular processes unique to each transcriptome dataset and shared between datasets are shown. (B) Network among the five genes dysregulated in all five HCM transcriptome datasets, and cellular processes that connect four of the five dysregulated genes.

