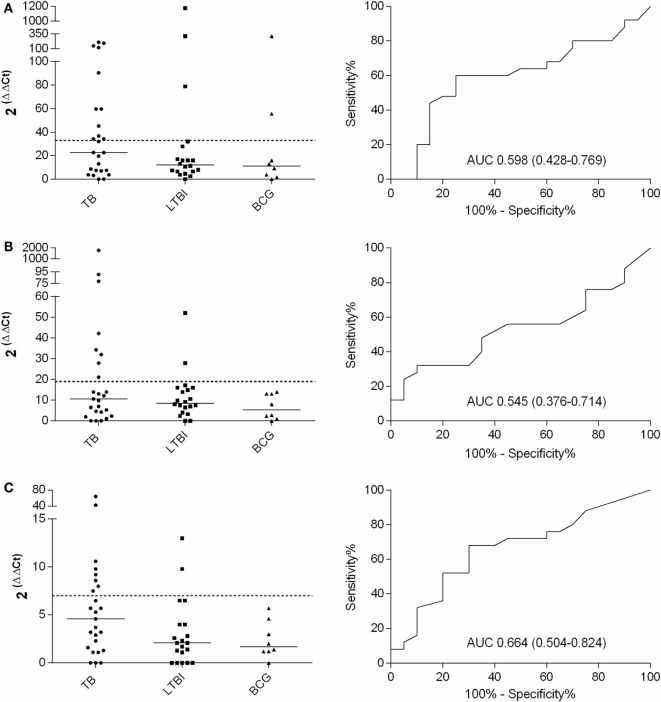
Figure 2.
Fold increases in IFN-γ (A), IL-17 (B), and IL-4 (C) mRNA expression after PPD stimulation and the respective ROC curves with AUCs (CI 95%). TB, n = 25; LTBI, n = 20; and BCG, n = 8. The cutoff values for each assay are shown with dashed lines and the medians of the gene expression levels for each group with horizontal bars.

