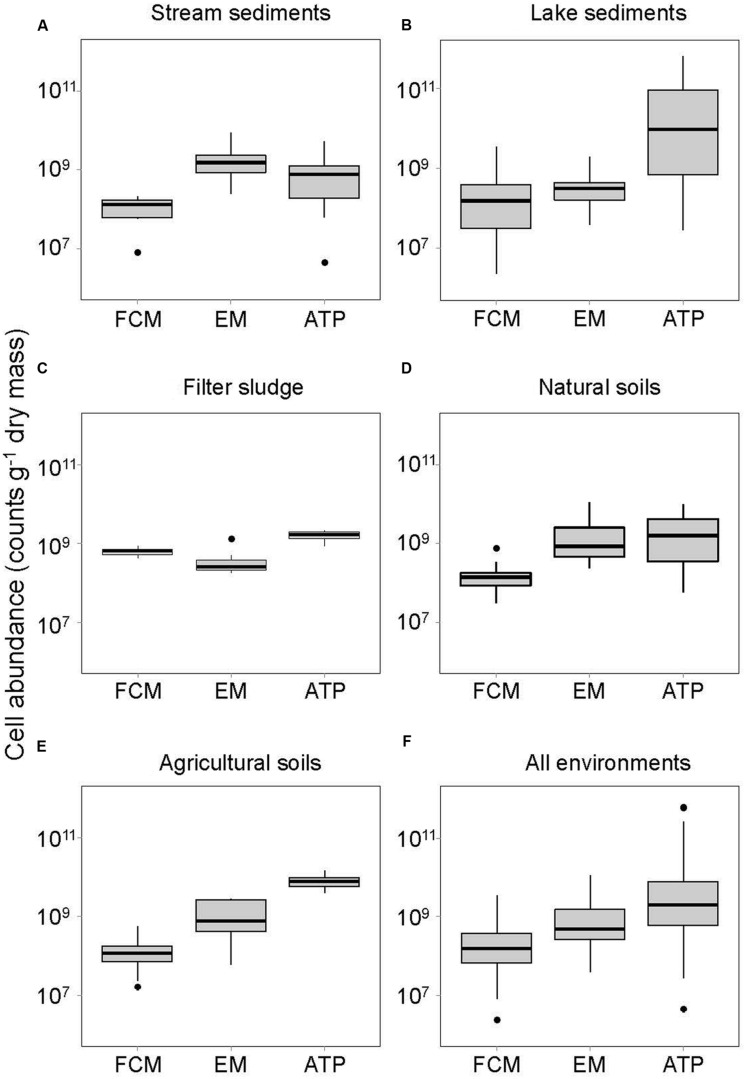
FIGURE 1.
Bacterial abundances assessed by three different methods (FCM, flow cytometry; EM, epifluorescence microscopy; ATP, ATP quantification) in (A) stream sediments, (B) lake sediments, (C) natural soils, (D) agricultural soils, (E) filter sludge of a drinking water treatment plant, and (F) all environments together. Horizontal thick lines show median values, boxes denote values comprised within the lower and upper quartile of the data, thin vertical lines represent ranges, and • indicate outliers.

