Figure 5.

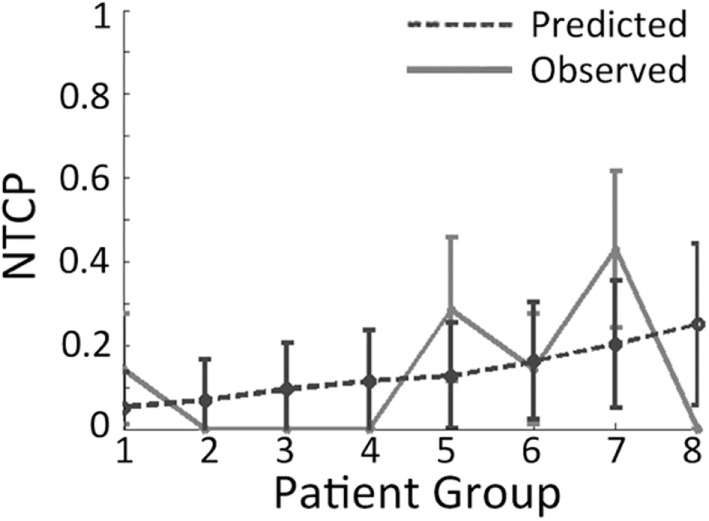
Example of an octile plot demonstrating how patients are sub-divided into eight groups and then stratified according to the risk given by the model of interest.

Example of an octile plot demonstrating how patients are sub-divided into eight groups and then stratified according to the risk given by the model of interest.