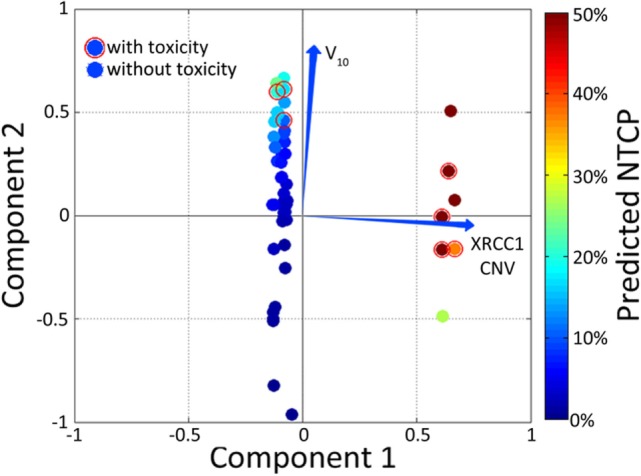
Figure 6.

Example of a color-washed vector biplot. The cardinal plane represents the vector biplot relating to the magnitude of the contribution of the variables contained within the model. The axes on which the vector biplot is shown are derived via principle component analysis (PCA). Dummy patients with toxicity were circled with empty red circles and color-washed according to NTCP values generated via the model.
