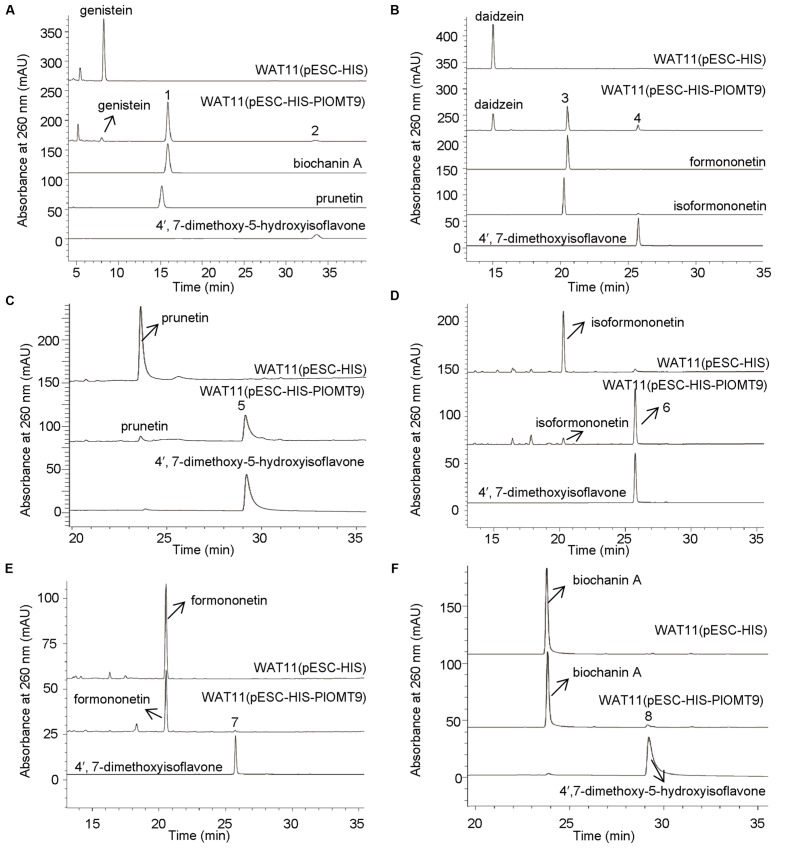
FIGURE 3.
LC-MS analysis of the products from the in vivo assays in yeast cells. (A)–(F) show the products of the PlOMT9-expressed cells fed with the substrates genistein yielding biochanin A (peak 1) and 4′,7-dimethoxy-5-hydroxyisoflavone (peak 2), daidzein yielding formononetin (peak 3) and 4′,7-dimethoxyisoflavone (peak 4), prunetin yielding 4′,7-dimethoxy-5-hydroxyisoflavone (peak 5), isoformononetin yielding 4′,7-dimethoxyisoflavone (peak 6), formononetin yielding 4′,7-dimethoxyisoflavone (peak 7), and biochanin A yielding 4′,7-dimethoxy-5-hydroxyisoflavone (peak 8), respectively. WAT11 (pESC-HIS) represents the strain carrying the empty vector pESC-HIS as a control; WAT11 (pESC-HIS-PlOMT9) represents the strain expressing PlOMT9. The mass spectra of the peaks 1–8 and their corresponding authentic standards are shown in Supplementary Figure S1.

