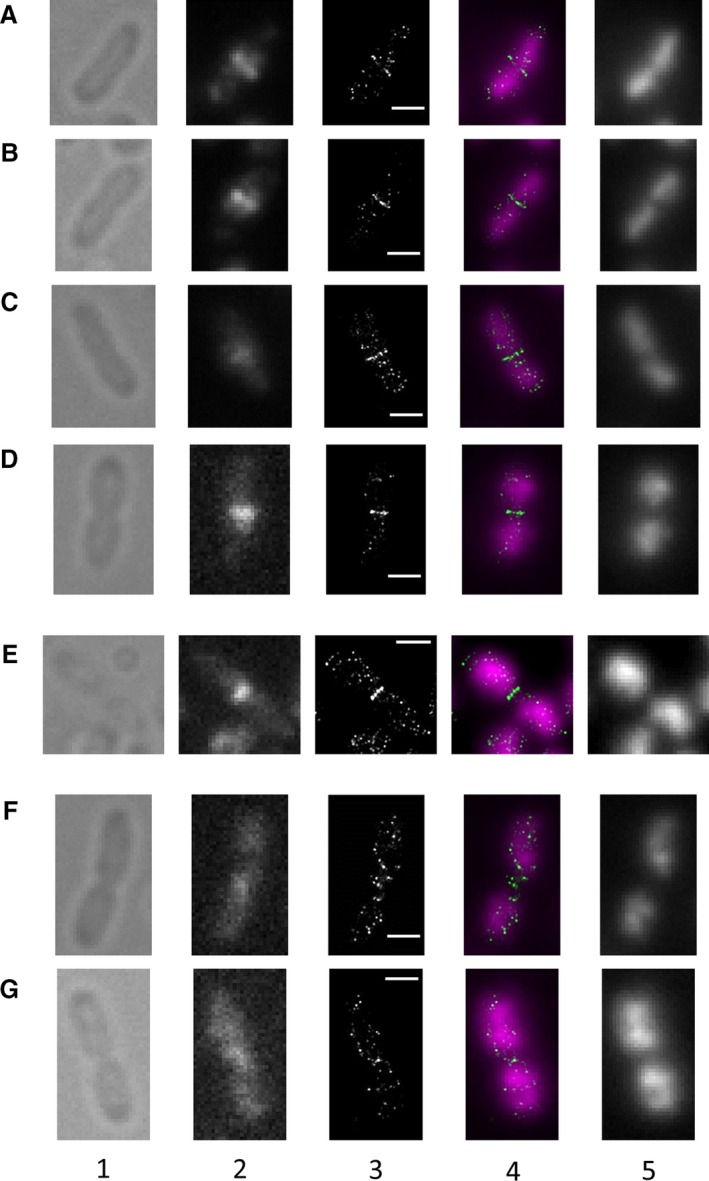
Figure 1.

Structures formed by FtsZ in Esherichia coli Top10 strain at different stages of the division process under conditions of fast growth. Columns: 1 – transmitted light images, 2 – diffraction‐limited FtsZ images, 3 – single‐molecule localization microscopy (SMLM) FtsZ images, 4 – composite of SMLM FtsZ (green) and diffraction‐limited DNA (magenta) images, 5 – diffraction‐limited DNA images. Rows: A–C – initial division stages prior to septation − the Z‐ring formation, D and E – septum constriction and the Z‐ring thickening, F and G – final stages of division and disassembly of the Z‐ring. Scale bar corresponds to 1 μm.
