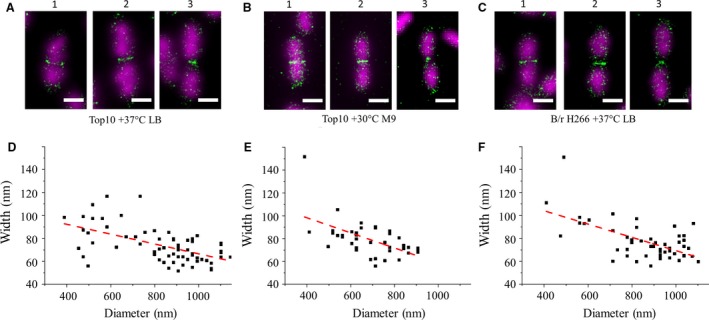
Figure 2.

Correlation between Z‐ring diameter and width. A, D – Top10 strain in fast growth conditions. Red dashed line on panel D corresponds to linear regression of scatter plot data y = ax + b, where a = −(43 ± 8)·10−3 (mean ± SD), b = 109 ± 7 nm. B, E – Top10 strain in slow growth conditions. Red dashed line on panel E corresponds to linear regression of scatter plot data y = ax + b, where a = −(66 ± 16)·10−3, b = 125 ± 11 nm. C, F – B/r H266 strain in fast growth conditions. Red dashed line on panel F corresponds to linear regression of scatter plot data y = ax + b, where a =−(58 ± 11)·10−3, b = 127 ± 10 nm. Panels 1, 2, 3 on A–C represent cells at early, middle, and late constriction stages, respectively. Only those cells in which FtsZ was localized as a regular‐shaped band at the mid‐cell were included in this analysis. Scale bar corresponds to 1 μm.
