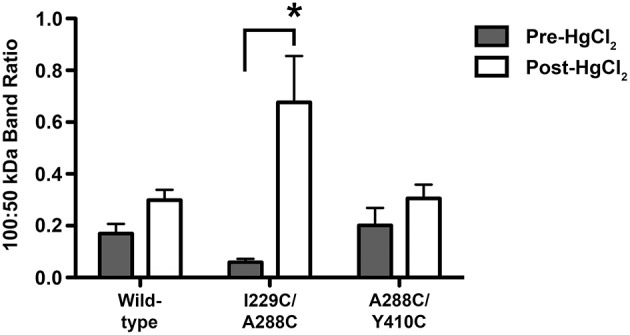
Figure 6.

Semiquantitative analysis of dimeric/monomeric band ratios resulting from uncrosslinked and crosslinked GlyRs. Crosslinking was obtained by applying 0.5% H2O2 by bath perfusion. Equal amounts of protein were extracted from oocytes, resolved by SDS-PAGE under non-reducing conditions, and transferred to a membrane where a GlyR alpha 1 antibody was used. Immunoblot images were processed using ImageJ64 software, and GLRA1-labeled band intensity was obtained for 50 and 100 kDa bands, which correspond to monomeric and dimeric GlyR subunits, respectively. Band intensities are reported as direct ratios (100:50 kDa). Immunoblot image analysis revealed a significant increase in the 100:50 kDa band ratio for the I229/A288C (TM1-3) double mutant after crosslinking, but not in the uncrosslinked mutant or in the corresponding wild-type samples. Conversely, no differences in the 100:50 kDa band ratios were detected between uncrosslinked (pre-H2O2) and crosslinked (post-H2O2) conditions for the A288C/Y410C (TM3-4) double mutant or in the corresponding wild-type samples. Statistically significant differences in band ratios between the pre-H2O2 and post-H2O2 conditions were measured and reported as a ratio (mean ± SEM; t-tests, *P < 0.05).
