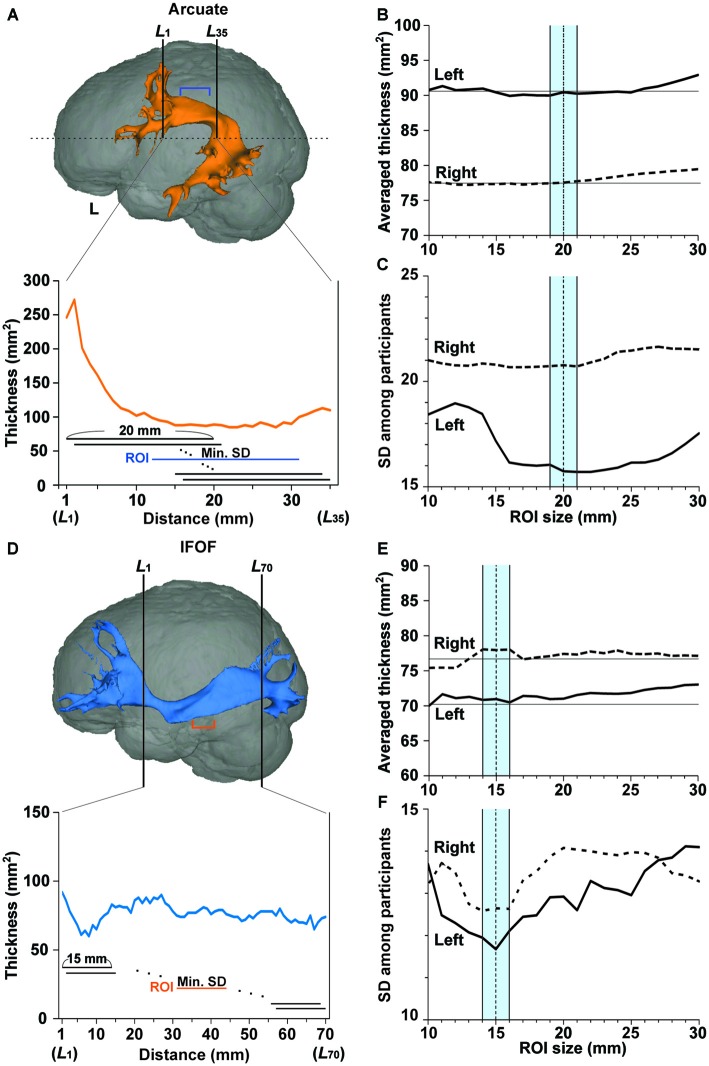
Figure 2.
Region of interest (ROI) selection to minimize individual variances in the fiber tract’s thickness. (A) A ROI (a segment shown by blue lines) in the left Arcuate reconstructed for the participant shown in Figure 1. Thickness was defined as the number of voxels (voxel size, 1 mm2) at each coronal section of the tracked fibers. In the lower graph, the tract’s thickness is shown at each of the L1~L35 cross-sections for the upper half of the brain (above the horizontal dashed line). Within a tract segment of a fixed length (e.g., 20 mm), we calculated the standard deviation (SD) of the tract’s thickness, and slid the segment between L1 and L35. Among these segments, the segment with a minimal SD, i.e., with the most uniform thickness, was selected as a ROI. (B,C) The averaged thickness and SD for various ROI sizes in the Arcuate. The mean thickness in the ROI was further averaged, and the SD was obtained among the participants. The averaged thickness or SD in the left and right hemispheres is shown by the solid and dashed lines, respectively. To minimize the SD, we chose a ROI size in the range of 19–21 mm (blue-shaded), in proportion to the individual size of the brain. (D) A ROI (a segment shown by orange lines) in the left IFOF reconstructed for the same participant. In the lower graph, the tract’s thickness is shown at each of the L1~L70 cross-sections. Among these segments, the segment with a minimal SD was selected as a ROI. (E,F) The averaged thickness and SD for various ROI sizes in the IFOF. The averaged thickness or SD in the left and right hemispheres is shown by the solid and dashed lines, respectively. We chose a ROI size in the range of 14–16 mm (blue-shaded), in proportion to the individual size of the brain.

