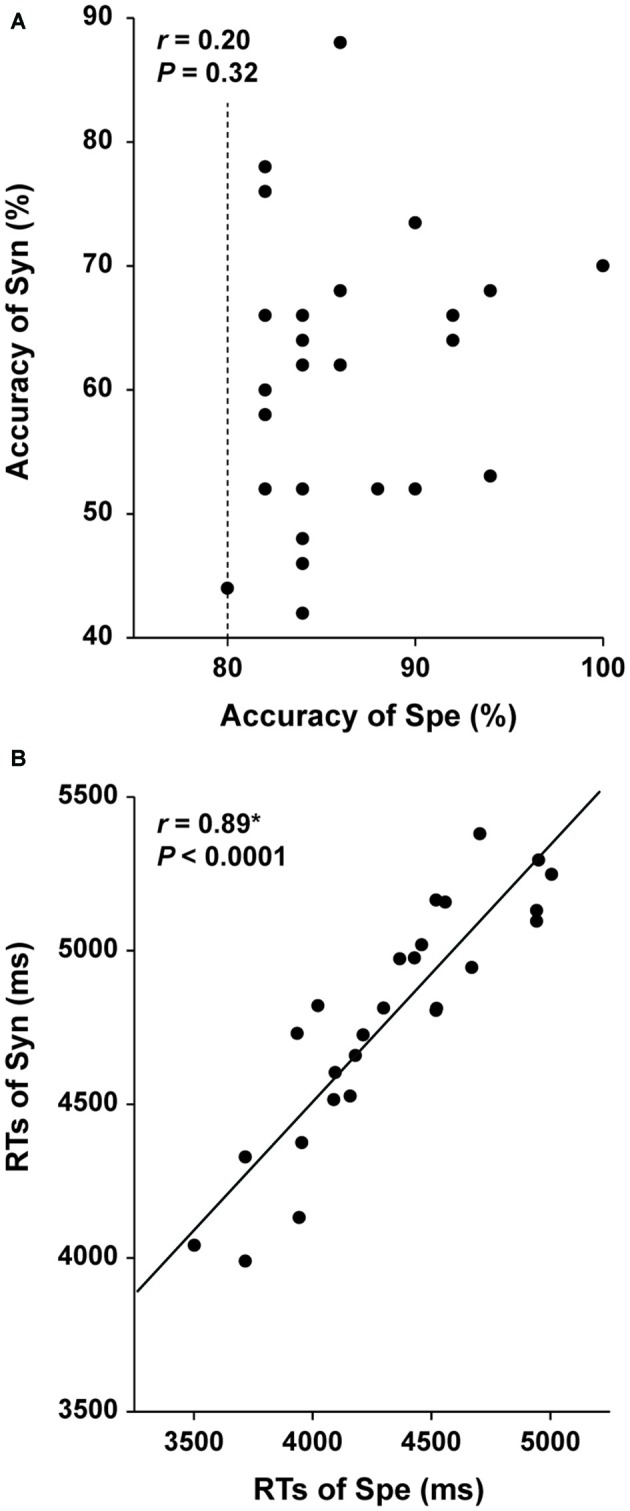
Figure 3.

Independence of the accuracy of the Syn and Spe tasks. Individual behavioral parameters in Experiment I are plotted for comparing the two tasks. The dotted line indicates an inclusion criterion of Spe employed in Experiment I. The accuracy of Syn and Spe showed no significant correlation (A), while reaction times (RTs) of Syn and Spe were highly correlated (B). An asterisk at r indicates corrected P < 0.05.
