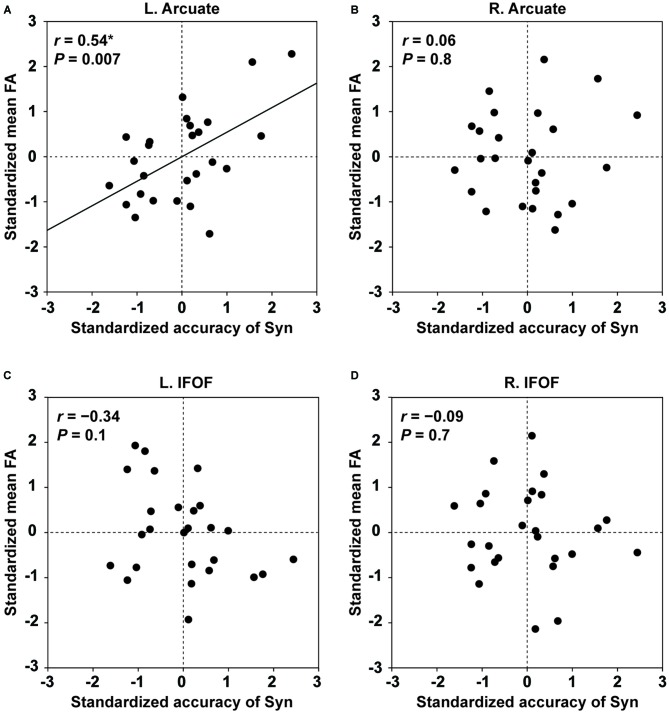
Figure 4.
Fractional anisotropy (FA) of the left Arcuate as an indicator of individual performances for the Syn task. The scatter plots of the standardized accuracy of Syn and the standardized mean FA in each ROI are shown for the left Arcuate (A), right Arcuate (B), left IFOF (C), and right IFOF (D). The effects of the standardized accuracy of Spe, gender, and laterality quotient (LQ) were removed. Uncorrected P values are also shown for each panel. Only the left Arcuate showed a significant correlation between FA and the accuracy of Syn.

