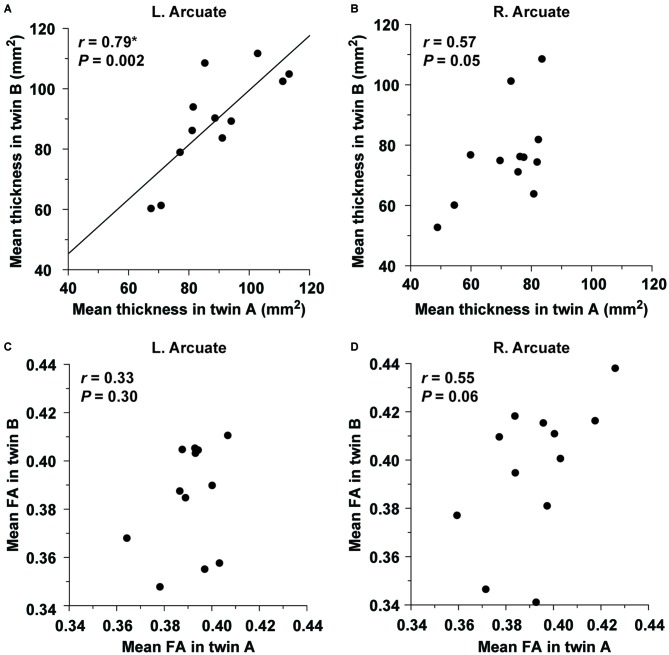
Figure 6.
The structural correlation of the left Arcuate within twin pairs. The mean thickness in the ROI of the left (A) or right (B) Arcuate is plotted for each pair of monozygotic twins. The plot of the mean FA in the ROI of the left (C) or right (D) Arcuate is also shown. Note the significant correlation for the mean thickness of the left Arcuate alone.

