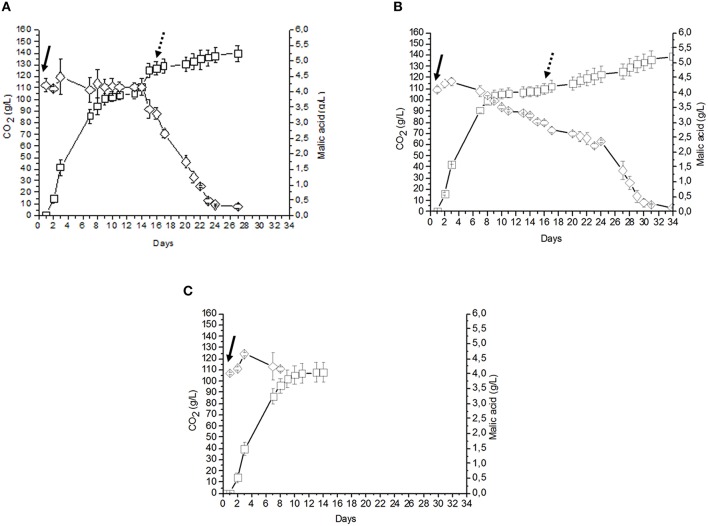
Figure 4.
(A) Fermentation performed using free (106 CFU/ml) S. cerevisiae cells, followed, at the end of AF, by free cells (106 CFU/ml) of O. oeni (sample C6). (B) Fermentation performed by free (106 CFU/ml) S. cerevisiae cells, followed, at the end of AF, by beads containing O. oeni (sample C7). (C) AF performed by an inoculum of free 106 CFU/ml S. cerevisiae cells (sample C8). CO2 (g/l) production  , Malic acid consumption
 . Inoculation time of S. cerevisiae
 , inoculation time of O. oeni
 .
.

