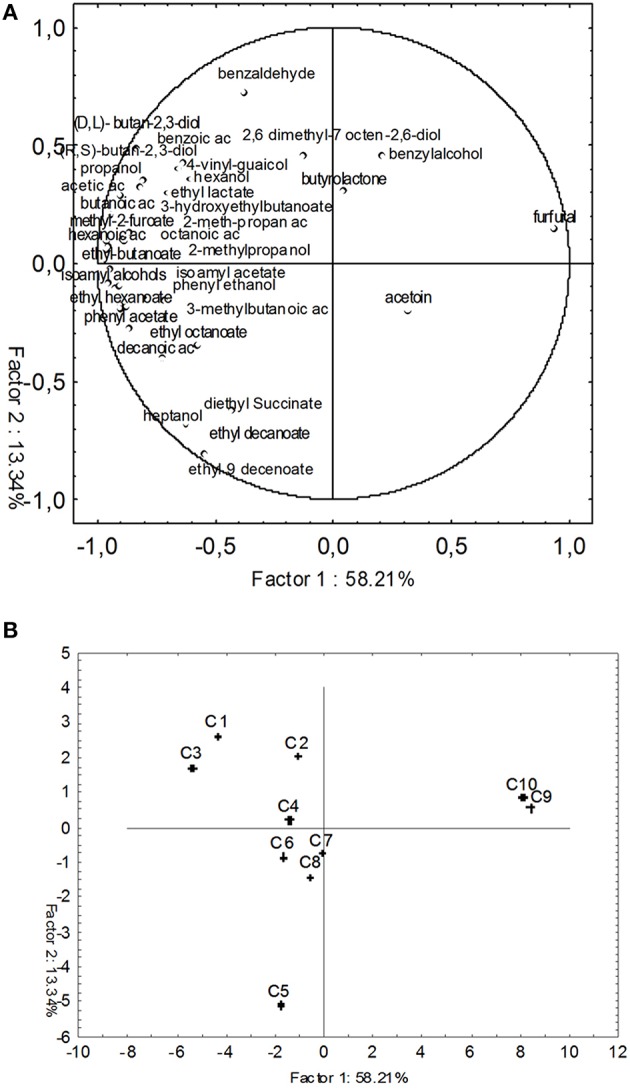
Figure 6.

PCA of volatile compounds associated with all tested fermentation samples. Score plot of variables (concentration of volatile molecules) and the end of fermentation in the plane formed by the first two principal components (PC1 against PC2). (A) Projection of the variables; (B) Projection of the cases.
