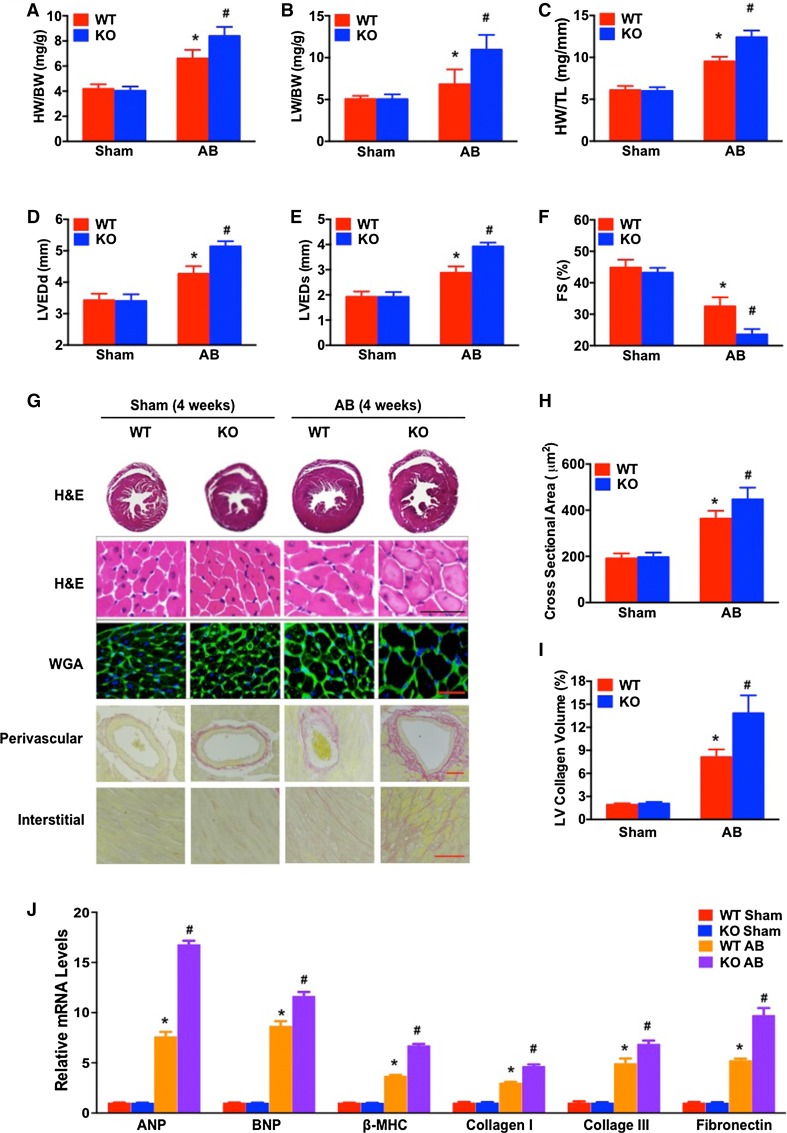
Fig. 4.
RGS14 ablation exacerbates pressure overload-induced cardiac hypertrophy. a–c The HW/BW, LW/BW, and HW/TL ratios were measured in RGS14 +/+ and RGS14 −/− mice 4 weeks after sham or AB treatment, n = 12–13 for each group. d–f Echocardiographic parameters (LVEDd, LVESd, and FS%) for RGS14 +/+ or RGS14 −/− mice after sham treatment and AB treatment (n = 4–7 per group). g Sections of hearts from RGS14 +/+ and RGS14 −/− mice subjected to AB or sham treatment were stained with H&E (first row: scale bar 50 μm), WGA (second row: scale bar 50 μm), and PSR (third row and fourth row: scale bars 50 μm) to analyze cardiac hypertrophy and fibrosis (n = 5 per group). h Quantification of cardiomyocyte cross-sectional area in sham-treated and AB-treated RGS14 +/+ or RGS14 −/− mice (n = 5 per group). i Quantification of fibrosis areas in sham-treated and AB-treated RGS14 +/+ or RGS14 −/− mice (n = 5 per group). j mRNA levels of hypertrophic and fibrotic markers in the hearts of RGS14 +/+ and RGS14 −/− mice subjected to sham treatment or AB treatment (n = 4 per group). The data are presented as the mean ± SD. *P < 0.05 vs. WT/sham. # P < 0.05 vs. WT/AB

