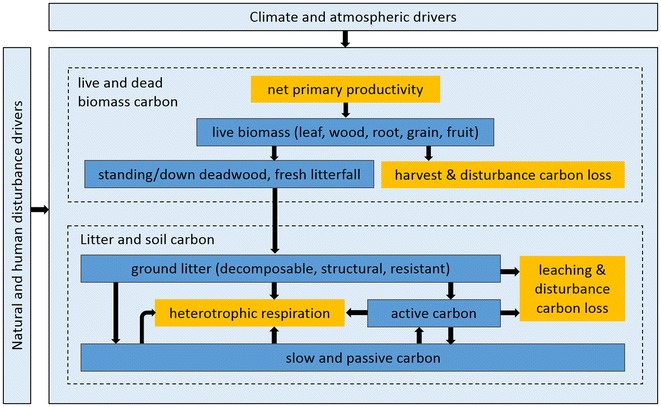
Fig. 2.

Overall ecosystem carbon cycling process simulated in IBIS. Blue boxes indicate carbon pools; orange boxes indicate carbon inputs and outputs to the ecosystem; arrows show carbon flow between pools. Climate and disturbance control the ecosystem productivity, respiration, and carbon removals
