Fig. 4.

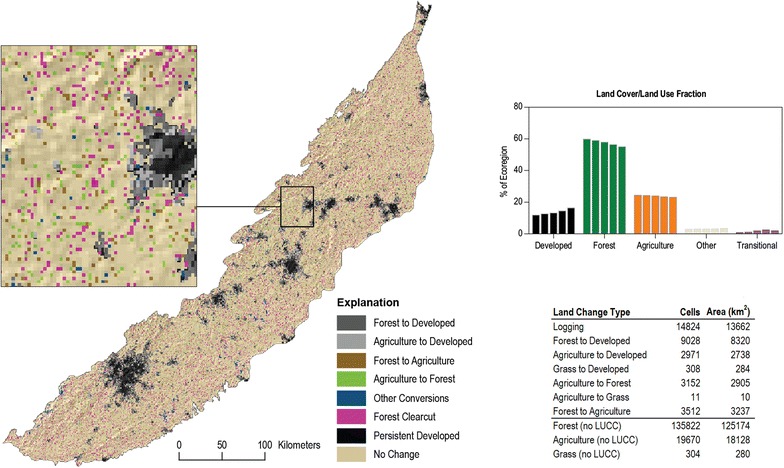
Total land cover change between 1971 and 2010 in the Piedmont ecoregion. Map is at 960-m resolution. Changing pixels indicate the simulated locations of land cover change

Total land cover change between 1971 and 2010 in the Piedmont ecoregion. Map is at 960-m resolution. Changing pixels indicate the simulated locations of land cover change