
Fig. 5.
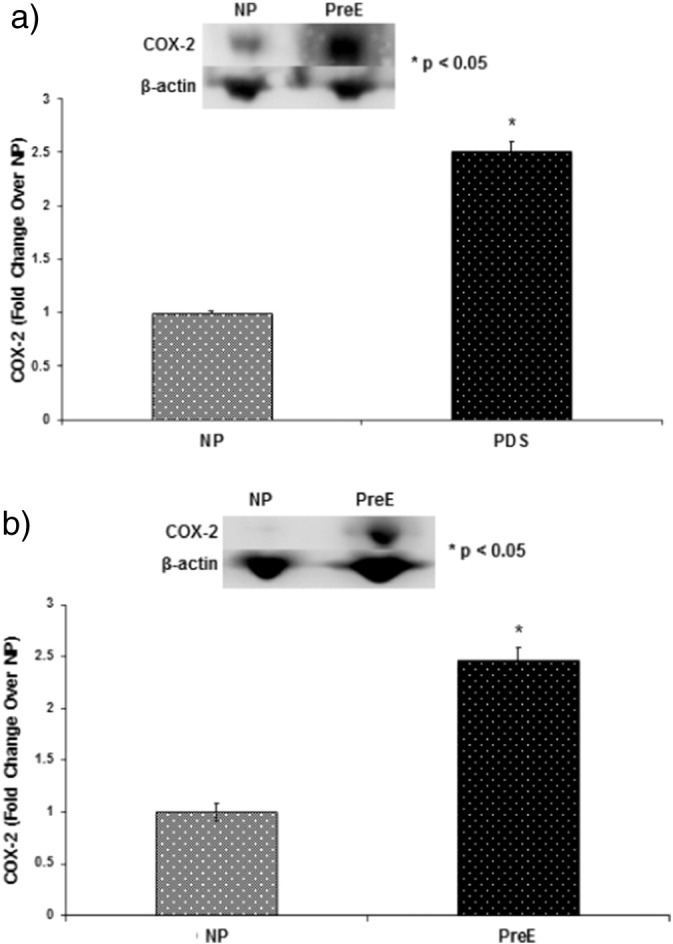
Representative blots of Cox-2 and beta-actin in placental (a) and umbilical cord (b) tissues from two groups of patients: NP (n = 15) and preE (n = 15). Graph presents means with SE of 15 experiments (each group) for the expression of Cox-2 relative to beta-actin in the tissue lysates of (A) placental and (B) umbilical cord by immunoblotting using anti-Cox-2 antibody. Cox-2 was significantly upregulated both in placenta and cord tissues of preE patients compared to NP (*p < 0.05). The results presented are the mean ± SE.