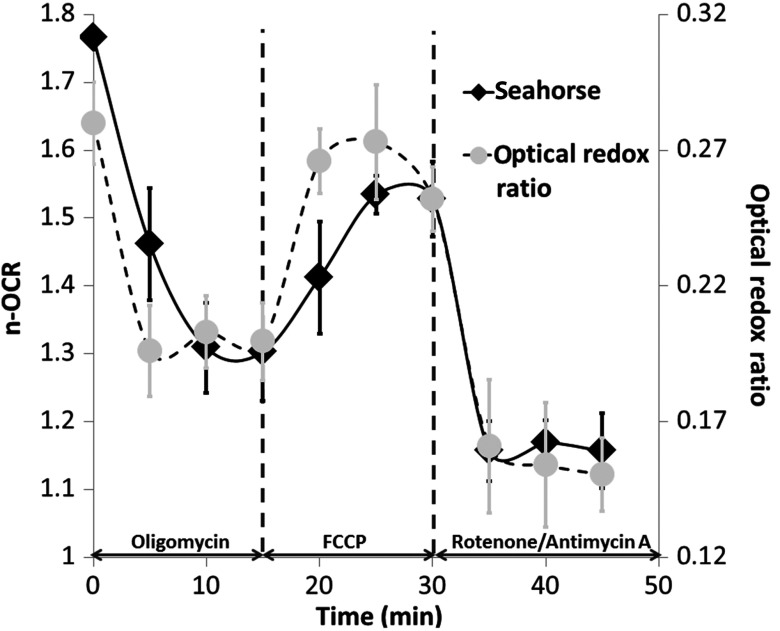
Fig. 2.
Dynamic monitoring of MCF-7 cell metabolism by TPEF microscopy (circles, dashed line) and seahorse flux analyzer (diamonds, solid line). Cells in regular culture conditions were measured at time and then treated with oligomycin, FCCP, and rotenone/antimycin A at , and 30 min in sequence. The n-OCR and ORR were measured every 5 min. The error bars for n-OCR come from the standard deviation of 12 measurements, and the error bars for ORR come from measurements on 25 different cells.

