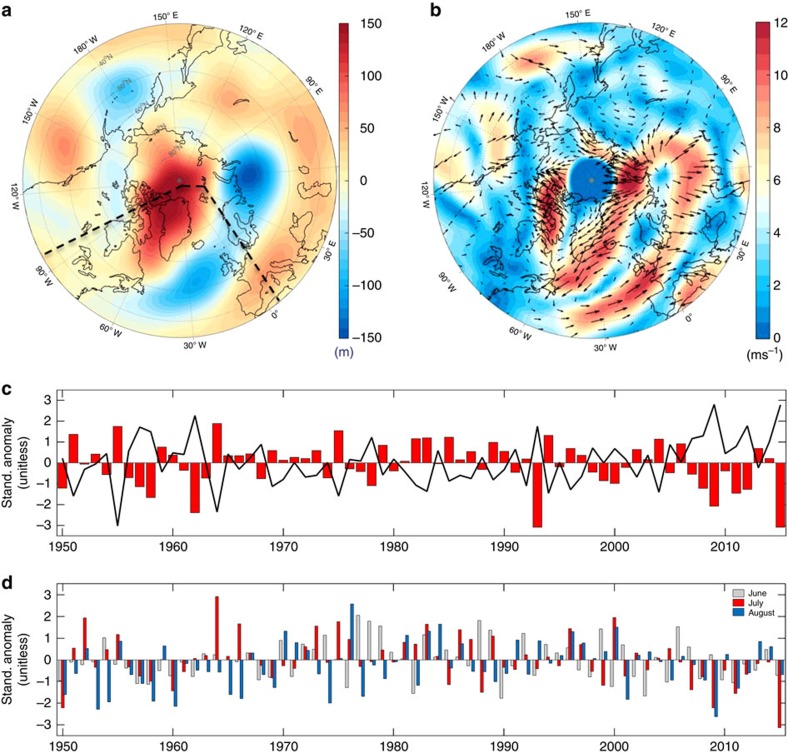
Figure 1. Atmospheric conditions and selected quantities over the Arctic and over the Greenland ice sheet.
(a) 500 hPa geopotential height composite anomaly (m) for the month of July 2015, with respect to the 1981–2010 baseline period (using NCEP–NCARv1 reanalysis); (b) same as a, but for the vector winds (ms−1). (c) Time series of monthly averaged July NAO (red bars) and GBI (black line) indices (unitless) for the period 1950–2015. (d) Time series of standardized anomalies for the zonal winds at 500 hPa (unitless) averaged over the months of June (light gray), July (red) and August (pale blue) over the region bounded between 45–85° N and 100° W–0° E (included in the area marked by the dashed lines in a).

