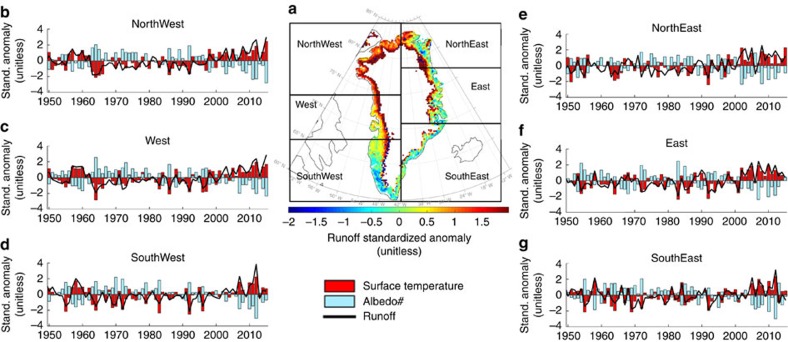
Figure 3. Surface mass balance and energy balance quantities over the Greenland ice sheet.
(a) Spatial distribution of the July 2015 MAR-simulated runoff anomaly (unitless) over the Greenland ice sheet (1981–2010). The boxes in the map display the boundaries of the different drainage regions. (b–g) Time series of standardized anomalies (unitless) for mean July runoff (black line), surface temperature (red bars) and surface broadband albedo (cyan bars) for the period 1950–2015 over the different drainage basin regions identified in a, as simulated by the MAR model.

