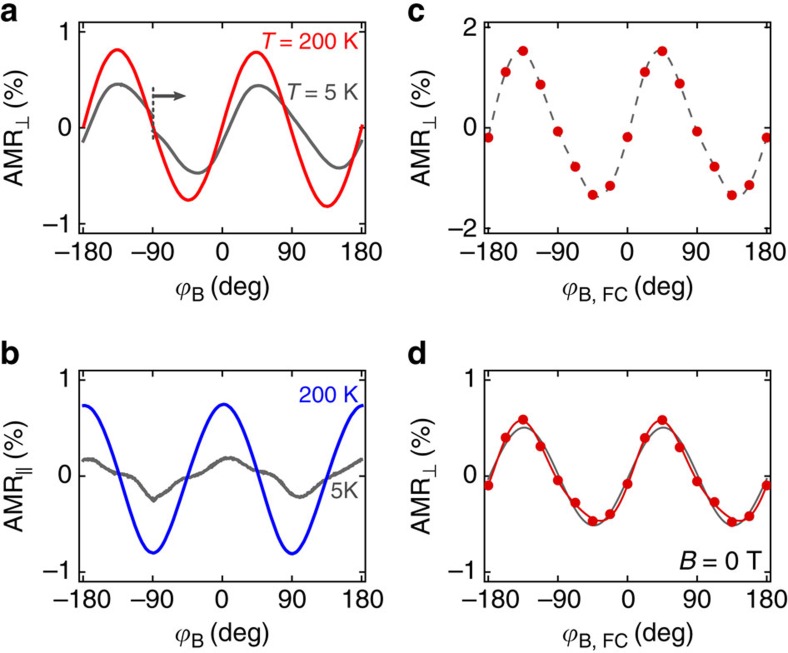
Figure 2. Antiferromagnetic AMR and multiple-stable memory.
(a,b) Transverse (red) and longitudinal (blue) AMR measurements at 200 K and rotating in-plane 2 T field. Analogous measurements at 5 K are shown in grey. Arrow in a indicates the initial angle and the direction of rotation. (c) Transverse AMR measured at 200 K after cooling from 350 K in a magnetic field (BFC=2 T) applied at an angle  ,FC and with the field kept on. The dashed line is a guide to the eye. (d) Zero-field transverse AMR obtained after field-cooling (BFC=2 T) down to 5 K then removing the field and taking zero-field resistance measurements at 200 K. The grey line is a
  least squares fit which fails to describe the details of the angular variation in the experimental data. On the other hand, the red line shows the least square fit of the multi-domain model calculations, which accurately reproduce the angular variation of the experimental data.

