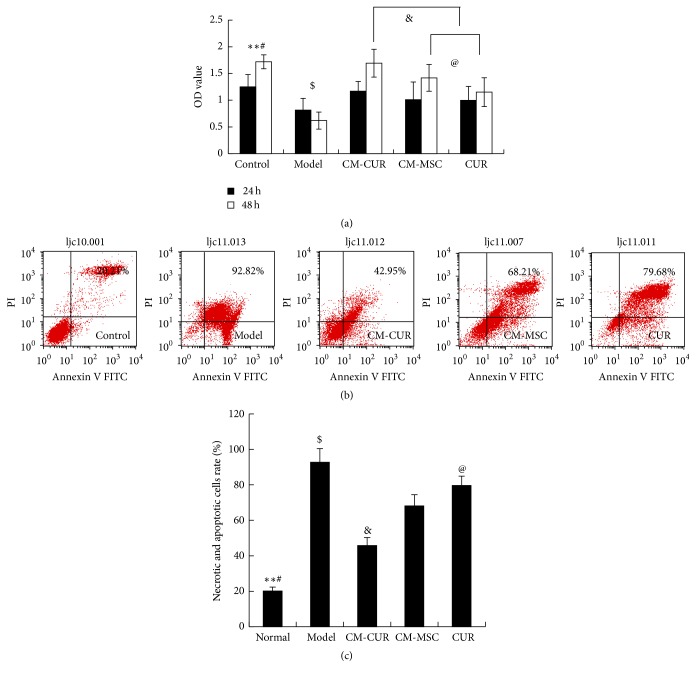
Figure 1.
(a) The OD value of PD model cells was gradually increased after treatment with CM-CUR, CM-MSC, and CUR at 24 h and 48 h ($ p < 0.05). There were obviously differences of promotingeffects onproliferation between the CM-CUR and the other two groups at 48 h (& p < 0.05). At 48 h, the OD values were lower in the CM-MSC and the CUR groups compared with the control group, and the difference was statistically significant (# p < 0.05). The OD value of CUR group was lower than that of the CM-MSC group (@ p < 0.05). (∗∗ p < 0.01: the control group versus the model group.) (b) The flow cytometry results showed that the sum of the necrotic rate and apoptotic rate was 20.21% in the normal cells, 92.82% in the model group, and 45.95%, 68.21%, and 79.68% in the CM-CUR, CM-MSC, and CUR groups, respectively. (c) Statistical analyses showed that the cell necrotic and apoptotic rate were lowest in the CM-CUR group and showed statistically significant differences compared with the model group (∗∗ p < 0.01), as well as the other two groups (@ p < 0.05). ($ p < 0.01 the normal control group versus the three groups, # p < 0.05 CM-MSC and CUR groups versus the model group.)

