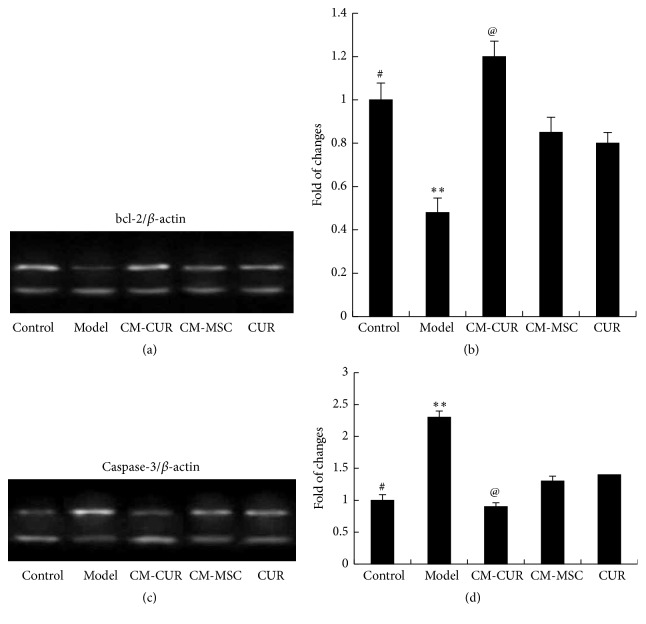
Figure 2.
Expressions of bcl-2 and caspase detected by RT-PCR: the bcl-2 mRNA expression was elevated (a, b) and caspase-3 mRNA expression was reduced (c, d) after the PD cell model was treated with CM-CUR, CM-MSC, and CUR for 48 h and showed statistically significant differences compared with the model group (∗∗ p < 0.01). The effect was still the strongest in the CM-CUR group (@ p < 0.05), which did not show any significant difference compared with the control group. The mRNA expressions in the CM-MSC and CUR groups were lower than the control group (# p < 0.05), while the difference between the CM-MSC and CUR groups was not significant.

