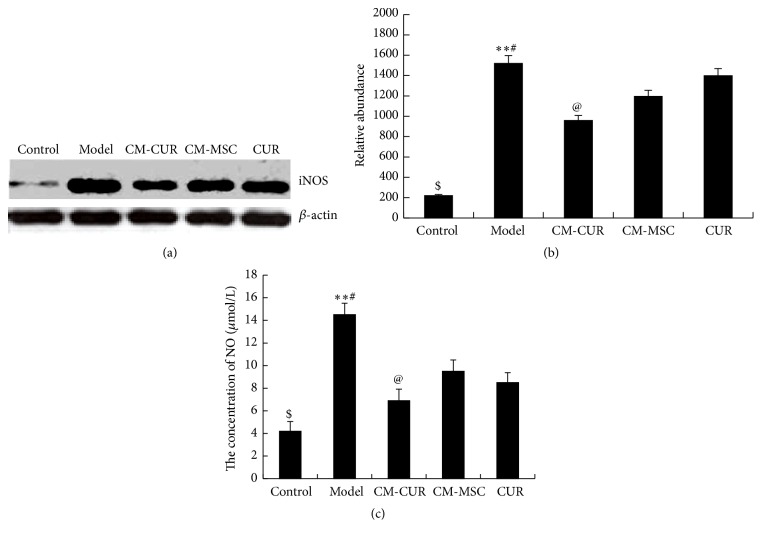
Figure 6.
The expressions of NO and iNOS in PD model cells. (a) Western blot assay revealed that iNOS was rarely expressed in the control group, with its expression suddenly increased in the model group and gradually decreased after treatment with CM-CUR, CM-MSC, and CUR (∗∗ p < 0.05). Among these, the effect was most obvious in the CM-CUR group (@ p < 0.05), followed by the CUR group and CM-MSC groups, with the difference between the latter two groups not being significant. However, the iNOS expressions in the three groups were still very high compared with the control group (# p < 0.01). (b) The tendency of NO content in the supernatant was consistent with that of the iNOS detected by Griess method.

