Figure 2.

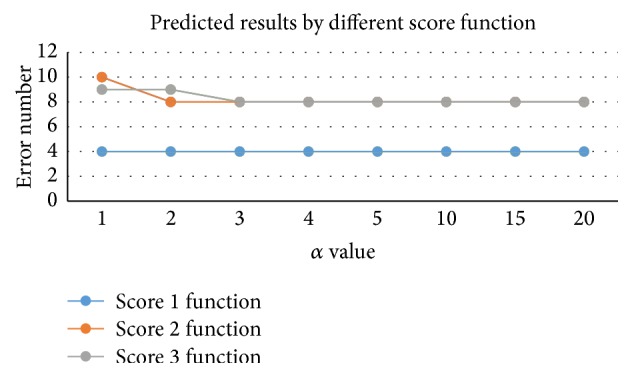
Predicted results by different score functions. x-axis represents different α values, and the y-axis refers to predicted results of different score functions.

Predicted results by different score functions. x-axis represents different α values, and the y-axis refers to predicted results of different score functions.