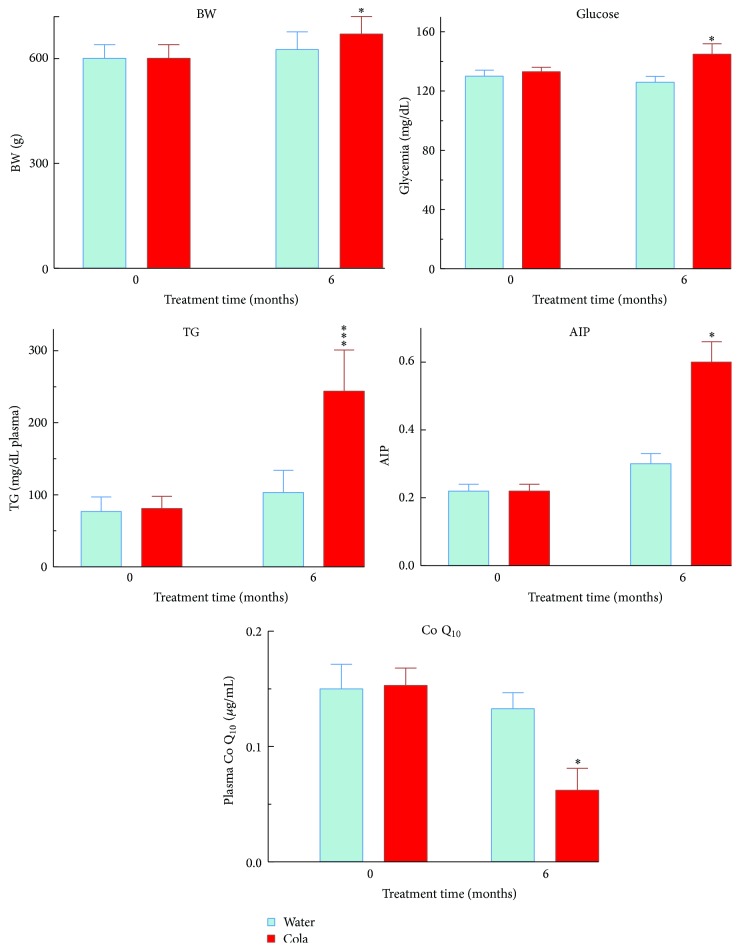
Figure 1.
Body weight, biochemical profile (general metabolism), and Q10 level before and after cola treatment. BW: body weight, TG: triglycerides, AIP: atherogenic index in plasma, and Q10: coenzyme Q10 (ubiquinone Q10). ∗ p < 0.05 and ∗∗∗ p < 0.001. Compared with W, C rats showed overweight (+8%, p < 0.05), hyperglycemia (+11%, p < 0.05), hypertriglyceridemia (2-fold, p < 0.001), higher AIP (2-fold, p < 0.01), and lower Q10 levels (−55%, p < 0.05).

