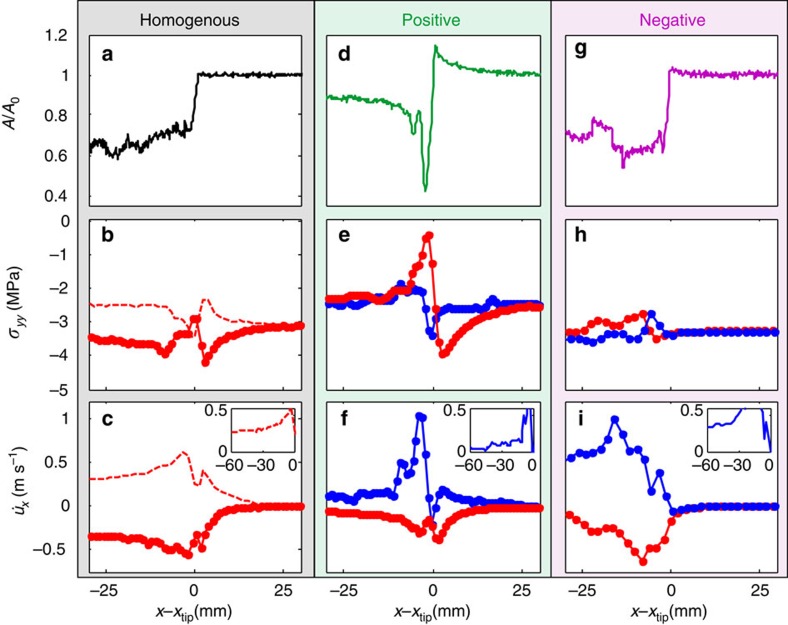
Figure 2. Contact area and normal stress and particle velocity measurements indicate slip-pulses in the positive direction and supershear cracks in the negative one.
Comparisons of contact area, A(x,t) (a,d,g), normal stresses, σyy(t) (b,e,h), and particle velocities,  , (c,f,i) for the ruptures presented in Fig. 1b. Signs of
  correspond to the motion directions denoted in Fig. 1a. Line colours represent measurements within the different blocks: red lines denote measurements within the stiff material (PMMA) and blue measurements within the compliant material (PC). (a–c) Homogenous interface, xtip=109 mm: (red dashed line) top block, (solid line) bottom block. Bimaterial interfaces, (d–f) positive direction, xtip=125 mm and (g–i) negative direction, xtip=87 mm. Ruptures along the positive direction are characterized by highly localized signals compared with those in the homogenous and negative directions. Insets in c,f and i:
  measurements for −60<x−xtip<0 demonstrate slip localization solely in the positive direction. Line colours in d and g correspond to the rupture propagation directions denoted in Fig. 1.

