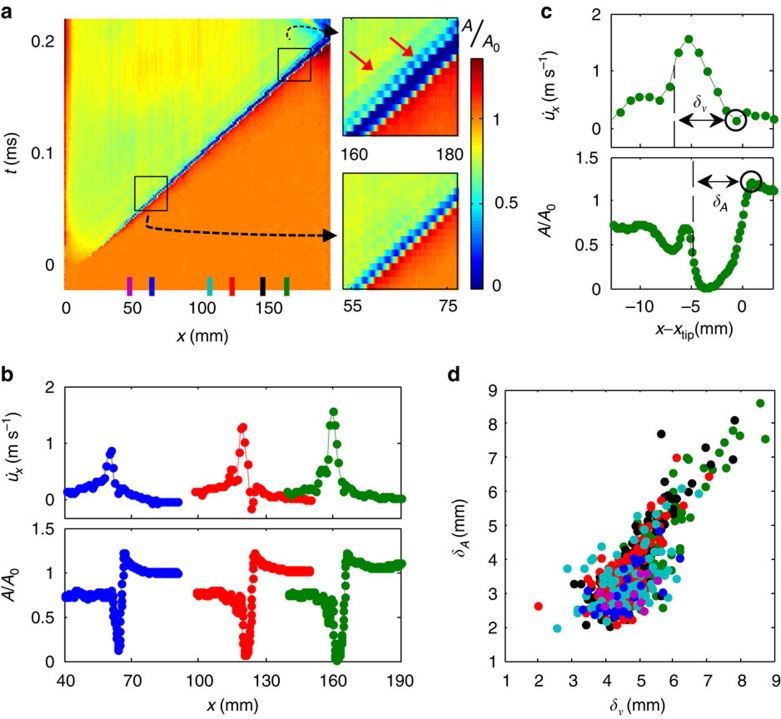
Figure 3. Slip-pulses continuously evolve with propagation.
(a) A(x,t) of a typical front in the positive direction. Right panels are close-ups of A(x,t) in the marked areas. Red arrows denote secondary and tertiary slip-pulses that follow the main slip-pulse which are absent during the earlier (55–75 mm) propagation. (b)  (x) (top) and A(x) (bottom) profiles along the interface. Each profile is displayed around xtip locations coinciding with the strain gauge locations (coloured lines) denoted in a. (c) Close-ups of
  (x−xtip) (top) and A(x−xtip) (bottom) for xtip=165 mm. We define pulse widths; δv is defined from the point where
  becomes positive (circle), to 2/3 of the difference between maximal and residual values (Methods). δA is defined from the point of maximal compression of A(x−xtip) (circle) to 1/3 of the difference between its residual and minimal values. (d) δA versus δv for 131 fronts for 2,000<FN<6,000 N. Colours: locations denoted in a.

