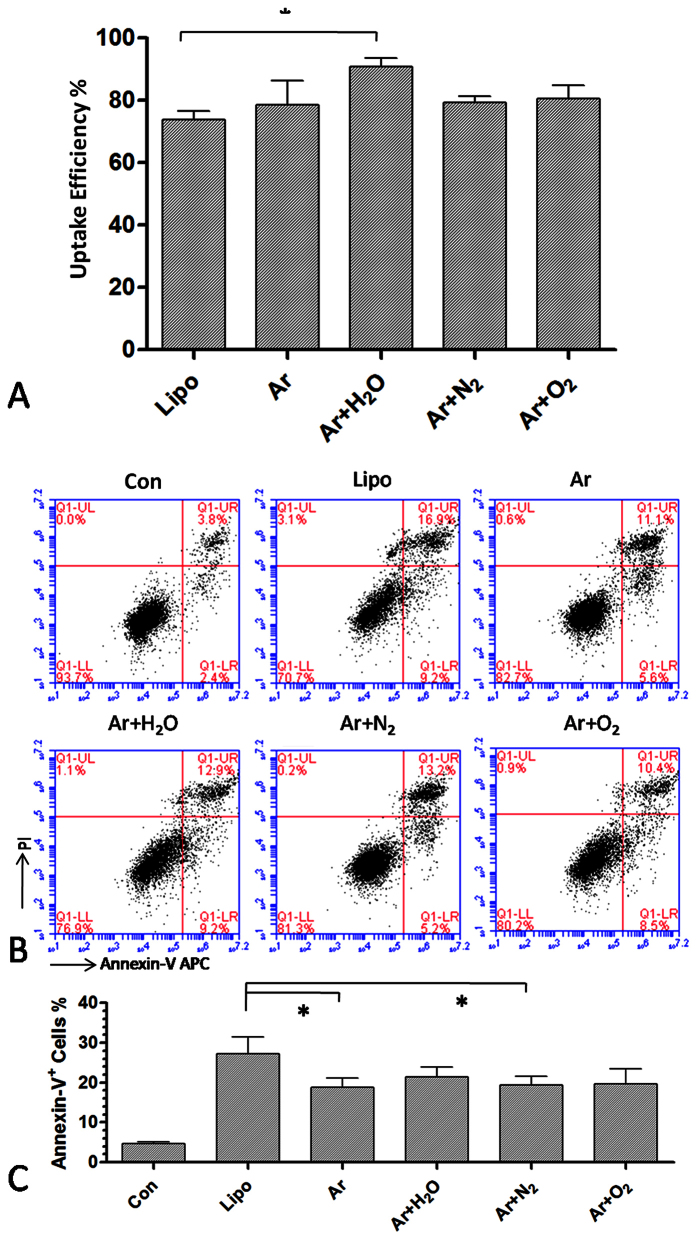
Figure 2. Uptake efficiency and cell apoptosis after plasma and lipofection transfection.
(A) Uptake efficiency measured by flow cytometry 24 h after plasma transfection for 20 s and lipofection. (B,C) Cell apoptosis measured by Annexin-V/PI staining 24 h after plasma transfection for 20 s and lipofection. (C) shows the percentage of Annexin-V+ cells in each group. n = 3, *indicates P < 0.05.

