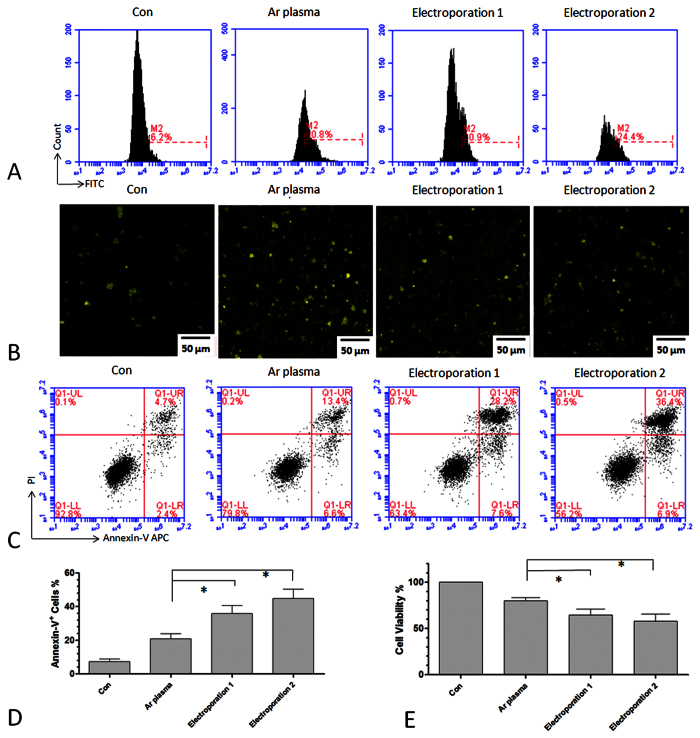
Figure 5. Uptake efficiency and cell apoptosis after plasma transfection and electroporation.
(A) Uptake efficiency measured by flow cytometry 24 h after Ar plasma transfection for 20 s and two conditions of electroporation. M2 labeled the fluorescence positive cells according to the control group. (B) Fluorescence images of LP-1 cells 24 h after Ar plasma transfection for 20 s and electroporations. (C,D) Cell apoptosis measured by Annexin-V/PI staining 24 h after Ar plasma and electroporation. (E) Cell viability measured by Cell-Titer-Glo 24 h after Ar plasma and electroporation. n = 3, *indicates P < 0.05.

