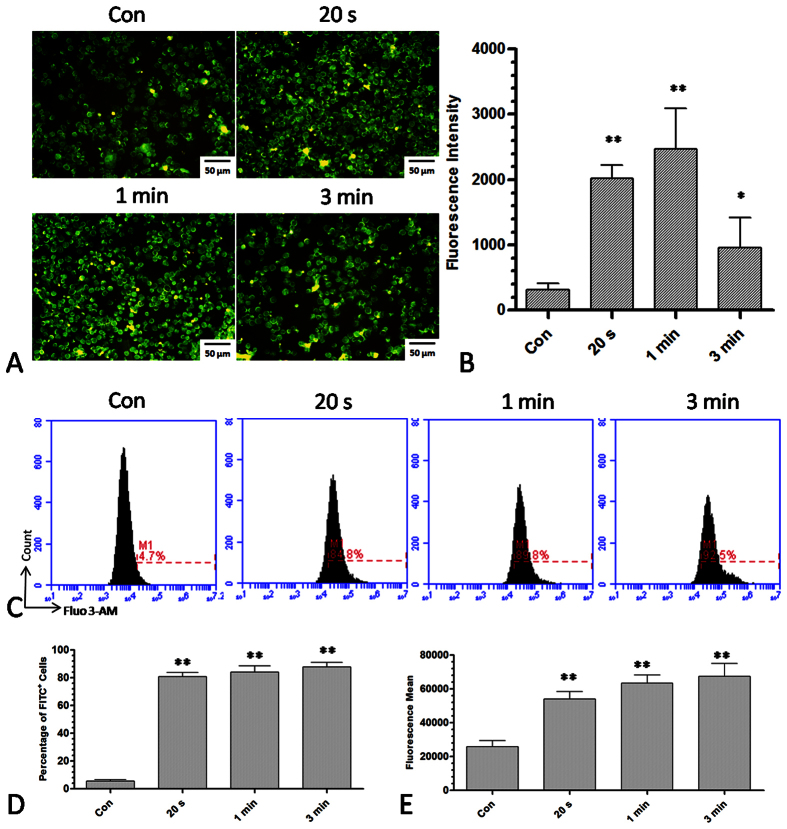
Figure 7. Detection of intracellular Ca2+ levels after plasma treatment for different durations.
(A,B) Fluorescence image and intensity of intracellular Ca2+ levels stained with Fluo 3-AM after plasma treatment for 20 s, 1 min and 3 min. (C) Measurement of the intracellular Ca2+ level by flow cytometry after plasma treatment for 20 s, 1 min and 3 min. M1 labeled the fluorescence positive cells with respect to the control group. (D,E) Percentage of fluorescence positive cells and fluorescence intensity after plasma treatment for 20 s, 1 min, and 3 min. n = 3, *indicates P < 0.05. **indicates P < 0.01.

