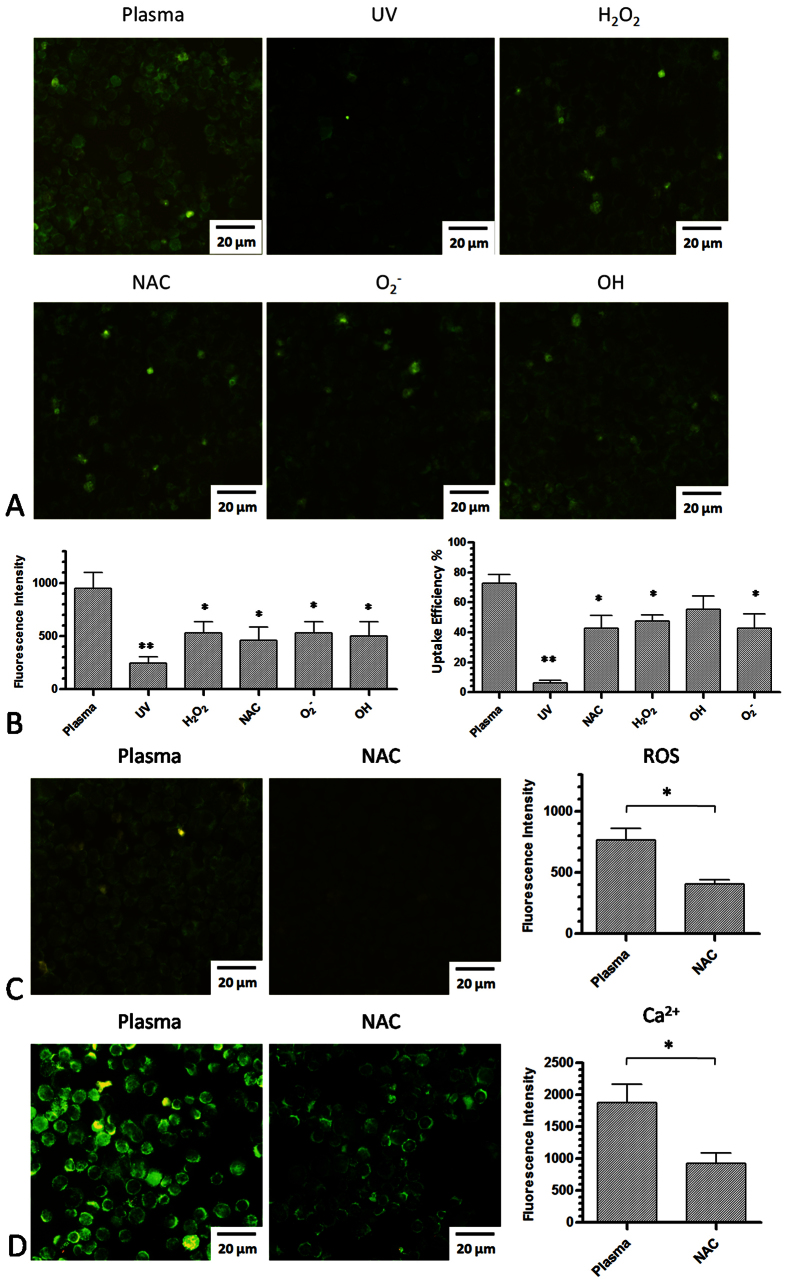
Figure 8. The effect of different ROS scavengers on plasma-transfection, ROS generation, and Ca2+ concentration.
(A) The effect of different ROS scavengers on plasma-transfection. UV indicates that only UV is available to affect cells as all other reactive species were removed by a quartz glass plate. (B) Measurement of fluorescence intensity and uptake efficiency by flow cytometry after adding different ROS scavengers. (C) The effect of ROS scavenger NAC on intracellular ROS generation. (D) The effect of ROS scavenger NAC on Ca2+ influx induced by plasma-transfection. n = 3, *indicates P < 0.05. **indicates P < 0.01.

