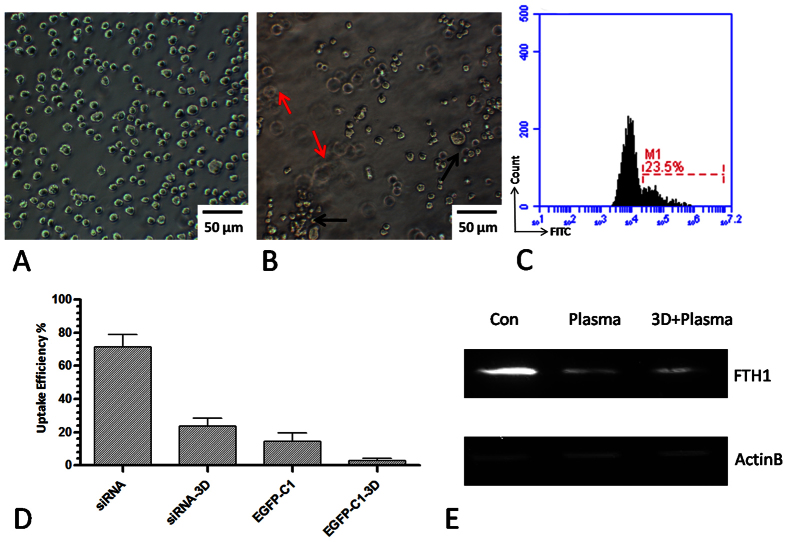
Figure 9. Transfection of siRNA-FITC, miRNA and EGFP plasmid by plasma-transfection in 2D and 3D cultured cells.
(A) LP-1 cells cultured in the normal 2D condition. (B) LP-1 cells cultured in the 3D condition. Black and red arrows indicate different levels of cells in the 3D condition. (C) Uptake efficiency of DNA-FITC by plasma-transfection in the 3D condition by flow cytometry. (D) Uptake efficiency of siRNA-FITC and pEGFP-C1 in 2D and 3D culture conditions by flow cytometry. n = 3. (E) Western blot analysis of FTH1 expression 48 h after transfection of miRNA in 2D and 3D conditions by plasma. n = 3.

