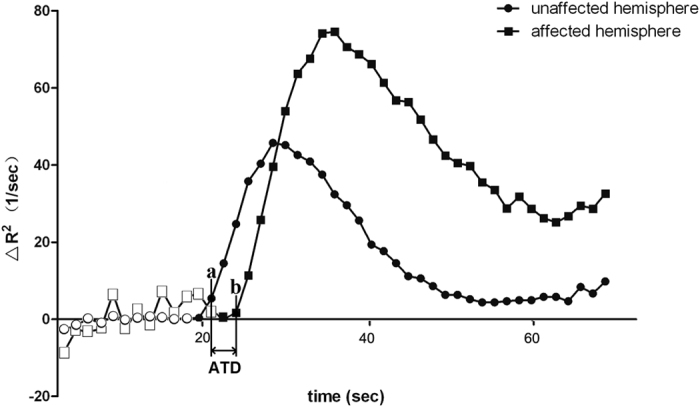
Figure 1. The time attenuation curves (TACs) of the ischemic and contralateral hemisphere.

Hollow dots indicate time points before contrast inflow. Point a and b indicate the first time point when contrast reached the selected artery on the arterial input function (AIF) curve of the contralateral and ischemic hemisphere, respectively. Arrival time delay (ATD) was defined as the time difference between these two points. In this case, the first time point of contrast inflow of both sides were 21.86 seconds and 24.46 seconds, respectively. Thus, the ATD was 3.6 seconds.
