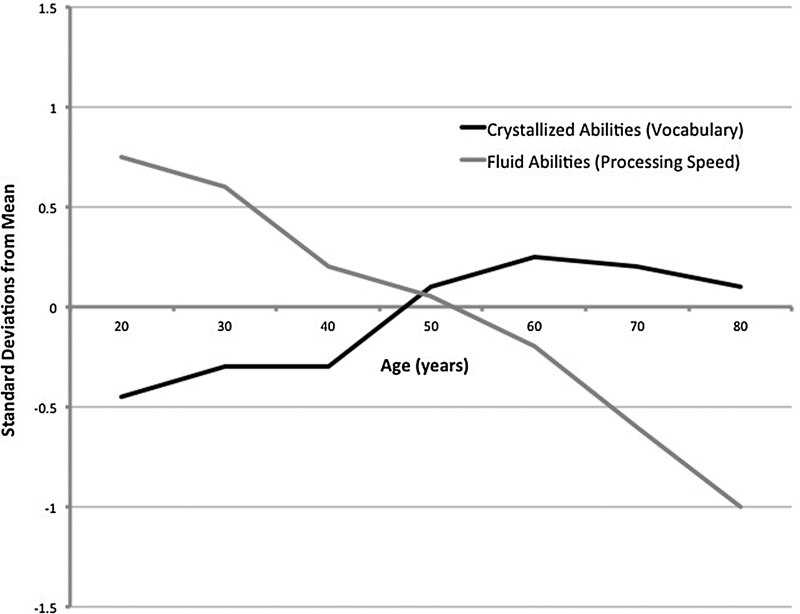
Figure 1.

Change in “crystalized” cognitive abilities, represented here as vocabulary, and “fluid” cognitive abilities, represented here as processing speed, with age in normal subjects. Graph is based upon data presented by T.A. Salthouse and colleagues.4 Zero line represents the mean or average performance on these measures, while values above zero represent better than average performance and below the line worse than average performance.
