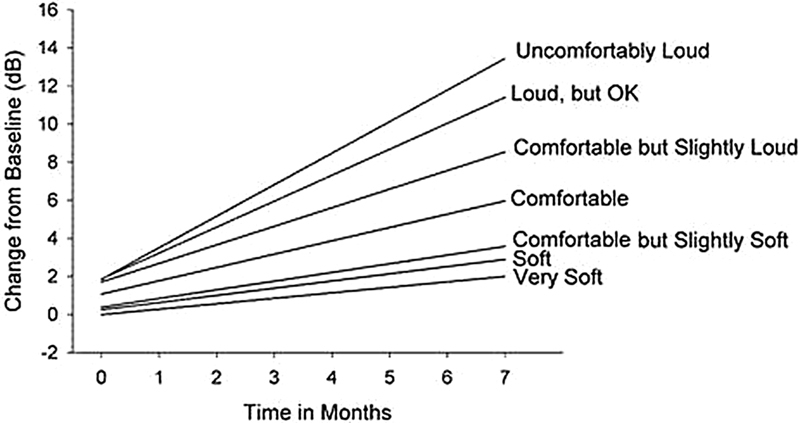
Figure 7.

Best-fitting (normalized to baseline) linear-regression functions characterize group 1 full-treatment dynamics for each of the seven loudness categories. Changes in the loudness judgments are shown for each category from Very Soft to Uncomfortably Loud over time of treatment in months.
