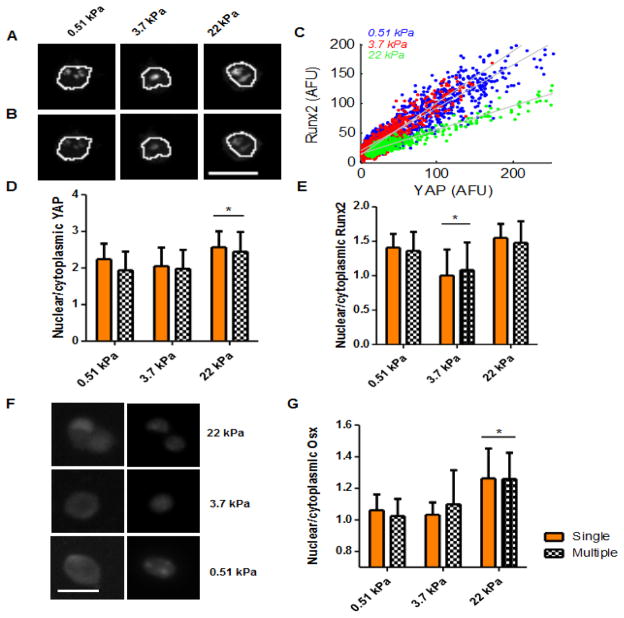
Figure 4.
Transcription factor localization in micropatterned cells at 7 hours of culture. Representative image of YAP stain (A) and runx2 stain (B) in a micropatterned cell grown on substrates of varying E. White lines outline nucleus. (C) Scatter plots of the pixel intensities of nuclear YAP and runx2 stains within the nucleus, in three micropatterned cells per stiffness condition. Gray lines represent least squares fit. Quantification of nuclear localization of YAP (D) and runx2 (E) on micropatterns on different E for islands with single or multiple cells, n > 25 cells per stiffness. * = p <0.05, n-way ANOVA. (F) Representative images of osterix (left) and nuclear (right) stained cells on different stiffnesses, n > 25 cells per stiffness. (G) Quantification of nuclear localization of osterix, n between 23 and 36 cells. * = p <0.05, n-way ANOVA. Scale bar, 20 um. YAP and Runx2 experimental repeats: 3; osterix experiment was performed once.

