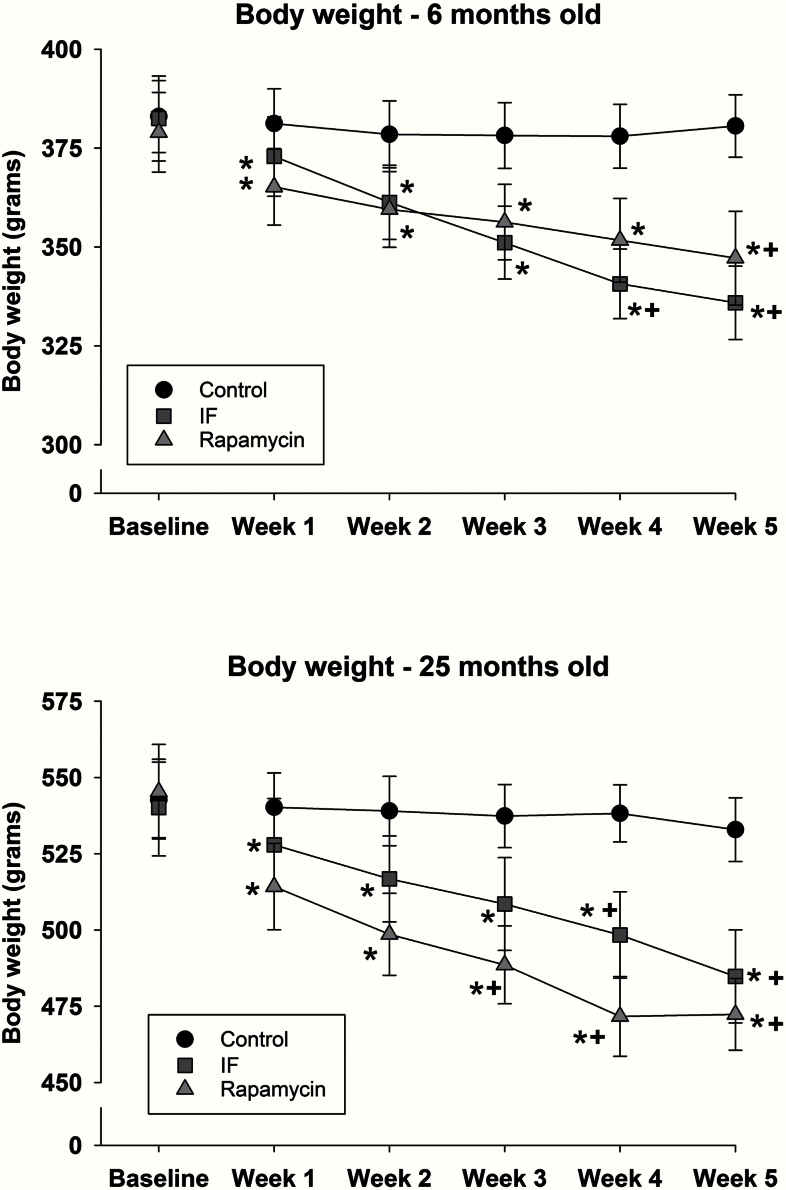
Figure 2.
Body weight in 6- (top) and 25-month-old rats (bottom) at baseline and during 5 weeks of rapamycin, intermittent feeding (IF), or control treatment. Mean data are shown, and error bars represent standard error of the mean. * indicates a significant decrease relative to baseline, and + indicates a significant difference from control.

