
Figure 1.
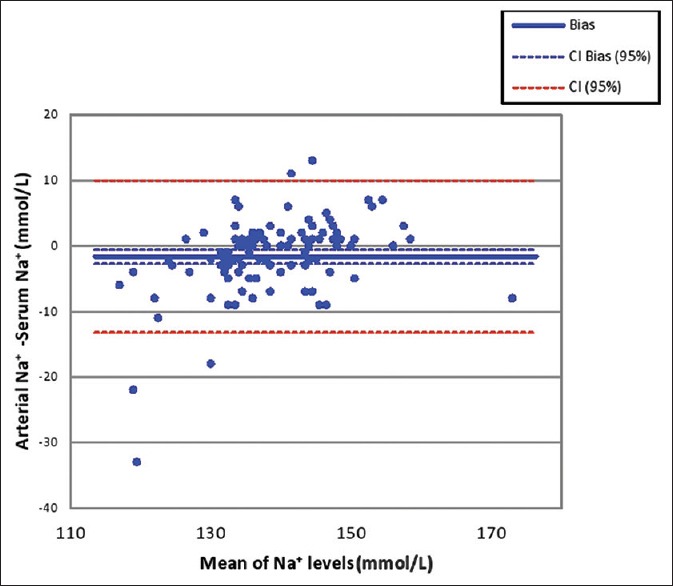
Bland–Altman plot for Na+ results in serum and arterial sample. The bias in arterial Na+ measurement is −1.63 mmol/L. The 95% limit of agreement is 9.9 to −13.2 mmol/L. Na: Sodium
Official websites use .gov
A
.gov website belongs to an official
government organization in the United States.
Secure .gov websites use HTTPS
A lock (
) or https:// means you've safely
connected to the .gov website. Share sensitive
information only on official, secure websites.
Bland–Altman plot for Na+ results in serum and arterial sample. The bias in arterial Na+ measurement is −1.63 mmol/L. The 95% limit of agreement is 9.9 to −13.2 mmol/L. Na: Sodium