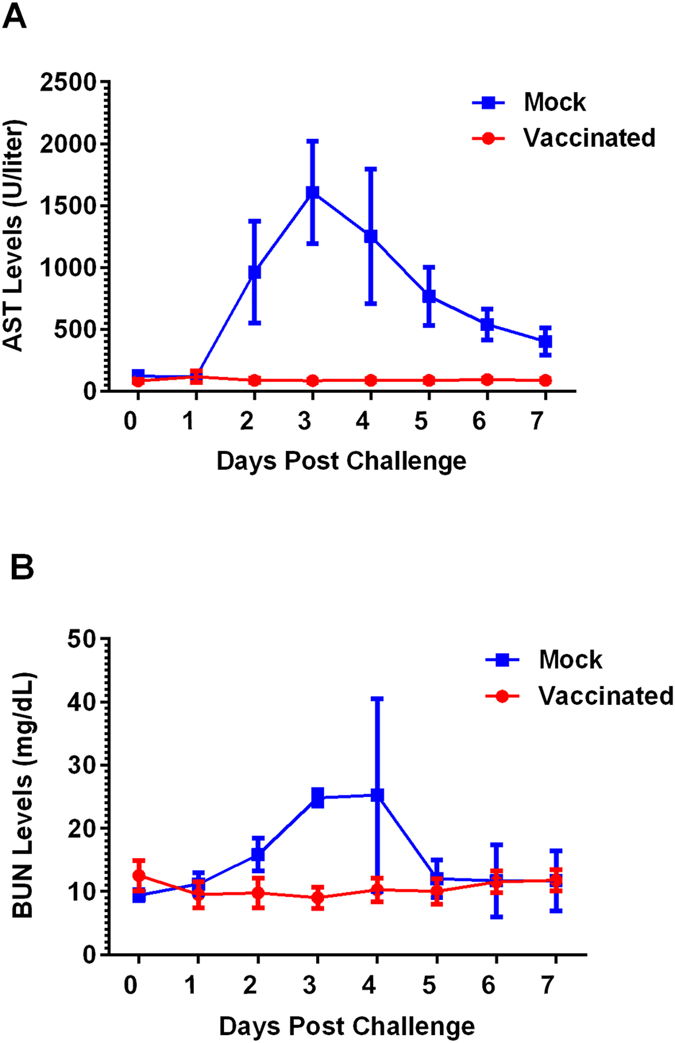
Figure 2. Blood chemistry analysis of serum samples from vaccinated and mock-vaccinated sheep following virulent RVFV challenge.

(A) Illustrates mean concentrations of serum AST; the mock group responded with significantly higher serum AST concentrations (P < 0.0001). (B) Illustrates mean concentrations of BUN in response to virulent challenge. The mock group responded with significantly higher serum BUN concentrations (P = 0.0001).
