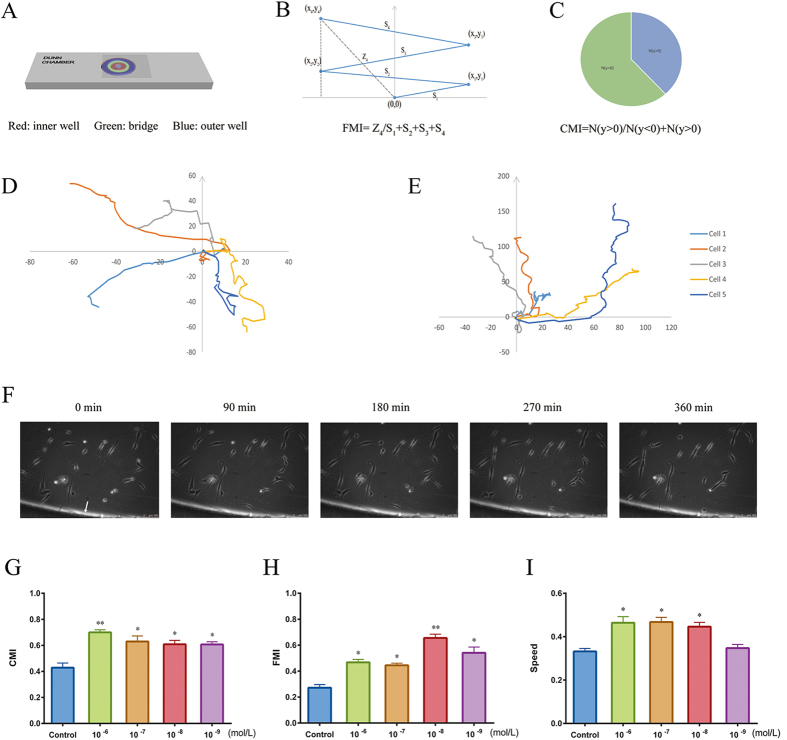
Figure 2. Analysis of CGRP-induced HUMSC chemotaxis with a Dunn chamber assay.
(A) Schematic model of the Dunn chamber device with the overlying coverslip, showing the position of the inner well (red), bridge (green), and outer well (blue). (B,C) Illustrations of FMI (B) and CMI (C), respectively. (D,E) Migration tracks of five representative cells in the absence of CGRP (D) and in the presence of 10−6 mol/L CGRP (E). The starting point for each cell is the intersection between the X- and Y-axes (0, 0), and the arrow represents the direction of the outer well. (F) Cells induced by 10−6 mol/L CGRP on the bridge between the inner and outer well of the chamber were observed under phase-contrast optics. The arrow points to the outer well of Dunn chamber. HUMSC migration was recorded continuously by time-lapse imaging. (G–I) CMI, FMI and migration speed (μm/min) for HUMSCs exposed to varying CGRP concentrations compared with control. Data are shown as the mean ± SEM from at least 3 independent experiments (*P < 0.05 and **P < 0.01).

