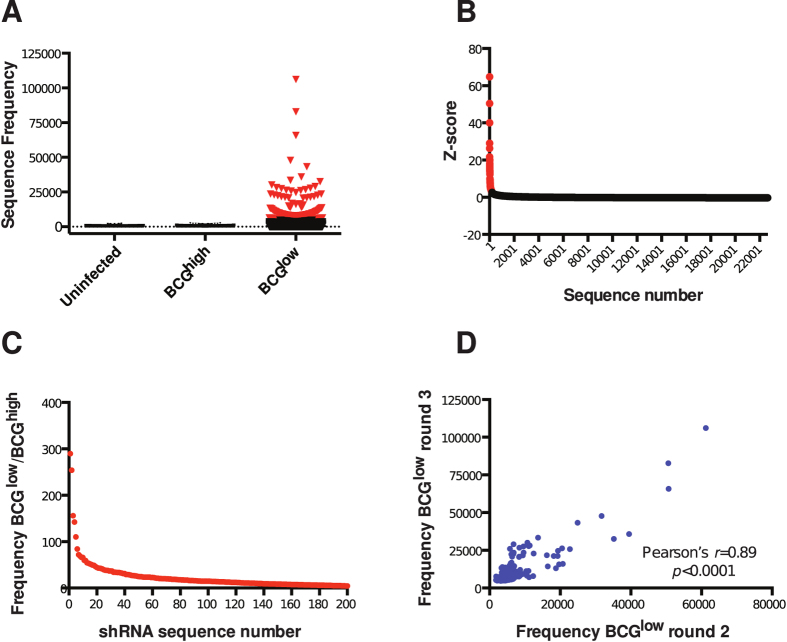
Figure 2. Two hundred and five “hits” identified in cells that resist BCG infection.
(A) Sequence frequencies in uninfected-, BCGhigh- and BCGlow- THP1 cells. Each symbol represents one sequence. Red symbols represent 205 sequences that are above the cut off value. (B) Distribution of Z-scores of sequences in BCGlow cells obtained after the third round of selection. Each symbol represents one sequence. Red symbols represent 290 sequences with Z-scores >2. (C) Ratio of frequencies of 205 “hits” between BCGlow- and BCGhigh cells. BCGlow cells obtained after the third round of selection were used in this calculation. (D) Correlation of 205 “hit” frequencies measured in BCGlow cells after the second and third rounds of selection.

