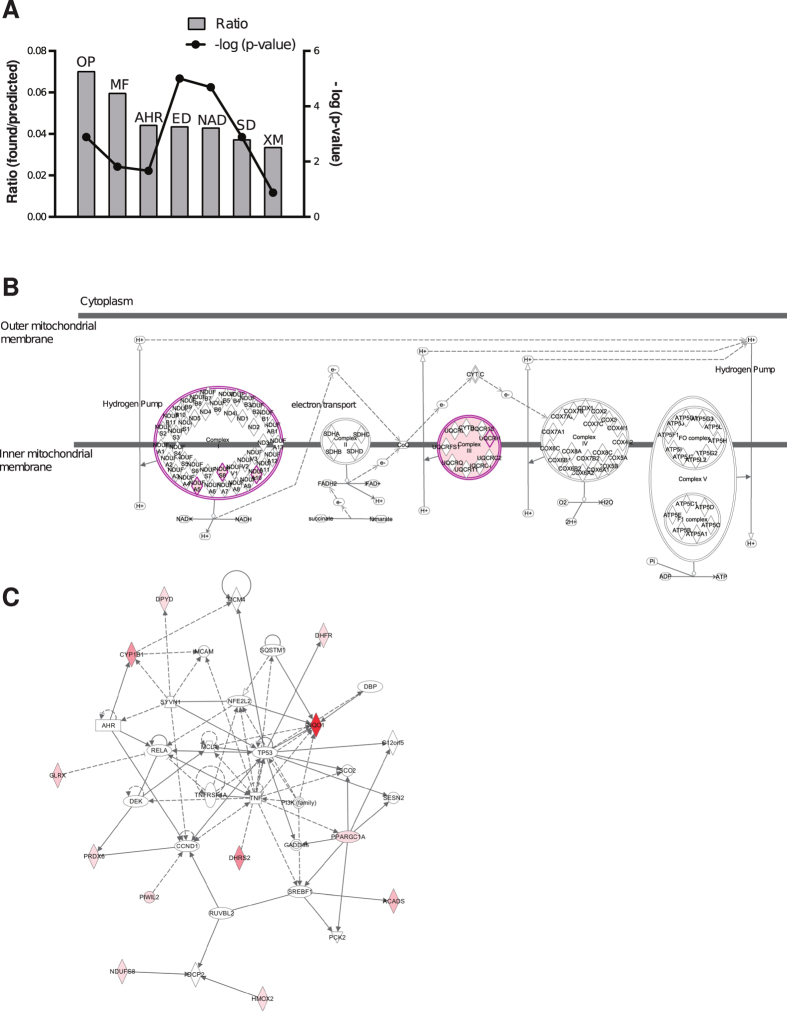
Figure 3. Main signaling pathways and protein networks identified by IPA® within the oxidoreductase functional group enriched in BCGlow cells.
(A) Bar graphs for the highest scoring canonical pathways ranked according to the ratios and statistical significance calculated by Fisher’s exact test right-tailed. The right y-axis displays the -log (p-values) corresponding to the points connected by a thin line. The bars represent the ratios, whose magnitudes are displayed on the left y-axis. Ratios are calculated as follows: number of genes in a given pathway identified as “hits”/total number of genes that make up that pathway in the reference gene set (i.e. human genome). OP = oxidative phosphorylation. MF = Mitochondrial function. AHR = aryl hydrocarbon receptor signaling. ED = ethanol degradation. NAD = noradrenaline and adrenaline degradation. SD = serotonin degradation. XM = xenobiotic metabolism signaling. (B) Schematic representation of the oxidative phosphorylation pathway highlighting (purple) the four members identified in the screening with the QIAGEN’s IPA®- software (NDUFA5, NDUFA10, NDUFS8, UQCRH). (C) The top QIAGEN’s IPA®-generated protein network (p < 0.0001) involved in energy production, molecular transport and nucleic acid metabolism includes twelve (red colored symbols) of the twenty-one oxidoreduction “hits” identified in BCGlow cells. Direct interactions are depicted with full lines and indirect interactions with dotted lines. The intensity of the red color of the symbols correlates with the level of enrichment of the correspondent shRNA in the screening. White symbols represent molecules that are part of the network but were not identified in the screening.

