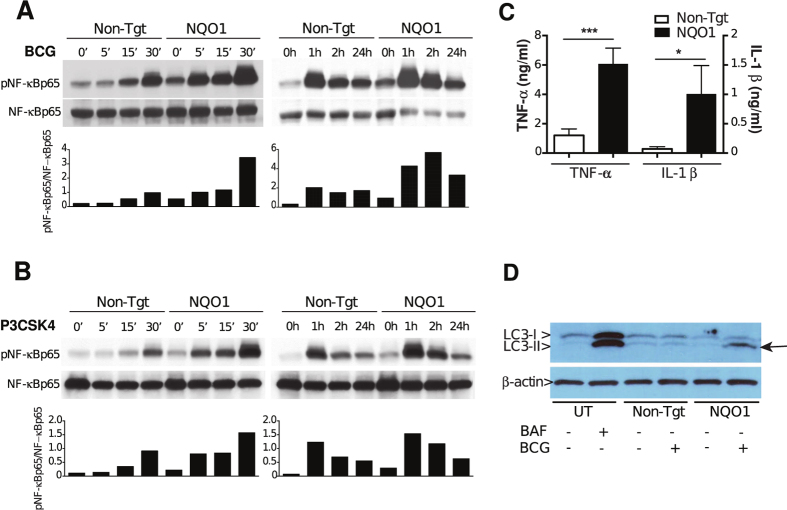
Figure 5. NQO1 deficient cells have increased pro-inflammatory responses to BCG infection.
(A,B) THP1 cells stably expressing non-targeting (Non-Tgt)- or NQO1 (NQO1)- shRNA were infected with BCG (A) or stimulated with P3CSK4 (B). NF-κBp65 phosphorylation was determined by Western blotting at different time-points post-treatment. The relative optical densities of phospho-NF-κBp65 (p-NF-κBp65) and total NF-κBp65 were measured with ImageJ software. Bar graphs represent the ratios between pNF-κBp65- and NF-κBp65- band optical densities. Representative experiments of a total of three with each stimulus are shown. (C) THP1 cells stably expressing non-targeting (Non-Tgt)- or NQO1 (NQO1)- shRNA were infected with BCG and TNF-α and IL1β were measured in 24 h culture supernatants by ELISA. Mean ± SEM of three independent experiments are shown. (D) Untransduced THP1 cells were treated with bafilomycin (BAF) and non-targeting (Non-Tgt) or NQO1 (NQO1)- shRNA transduced THP1 cells were infected with BCG and the autophagy marker LC3-II, and LC3-I were detected by Western blotting. One representative experiment of four is shown. Arrow indicates LC3-II accumulation. Statistical significance was determined by Student’s t test (C), ***p < 0.001.

