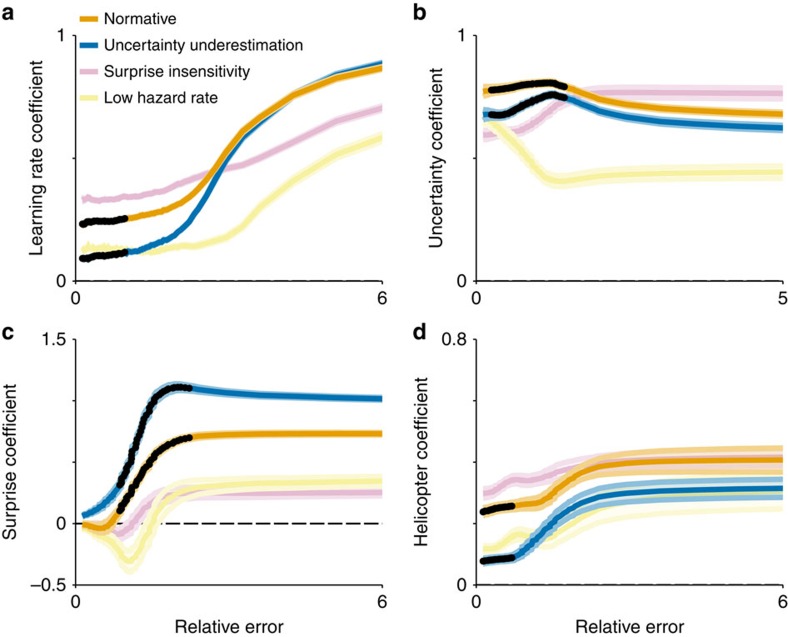
Figure 5. Uncertainty underestimation mimics altered behaviour in older participants.
Behaviour was simulated using a normative model (orange) and three deviant models: (1) surprise insensitivity (pink), (2) hazard rate underestimation (yellow) and (3) uncertainty underestimation (blue). Colours were chosen to emphasize that uncertainty underestimation deviates from the normative model in the same manner that older participants deviate from younger ones. (a) Mean/s.e.m. learning rate regression coefficients (line/shading) describing the effect of the prediction errors on the subsequent updates made by these models (see Fig. 3b). Only the uncertainty underestimation model shows a selective learning deficit in these bins. (b) Mean/s.e.m. uncertainty regression coefficients (line/shading) are plotted separately for each simulated model across all relative error bins (compare with Fig. 4a) (c) Mean/s.e.m. surprise regression coefficients (line/shading) are plotted separately for each simulated model across relative error bins (compare with Fig. 4b). (d) Mean/s.e.m. regression coefficients (line/shading) describing the effects of the helicopter over simulated model updates for trials when it was visible (for example, how much does the model adjust estimates towards the observed helicopter; compare with Fig. 4c). In all panels, dark points mark bins with significant differences between younger and older participants (permutation tests for cluster mass, n=57 per group, all P values <0.05) and lines/shading reflect mean/s.e.m. of simulated model behaviour.

