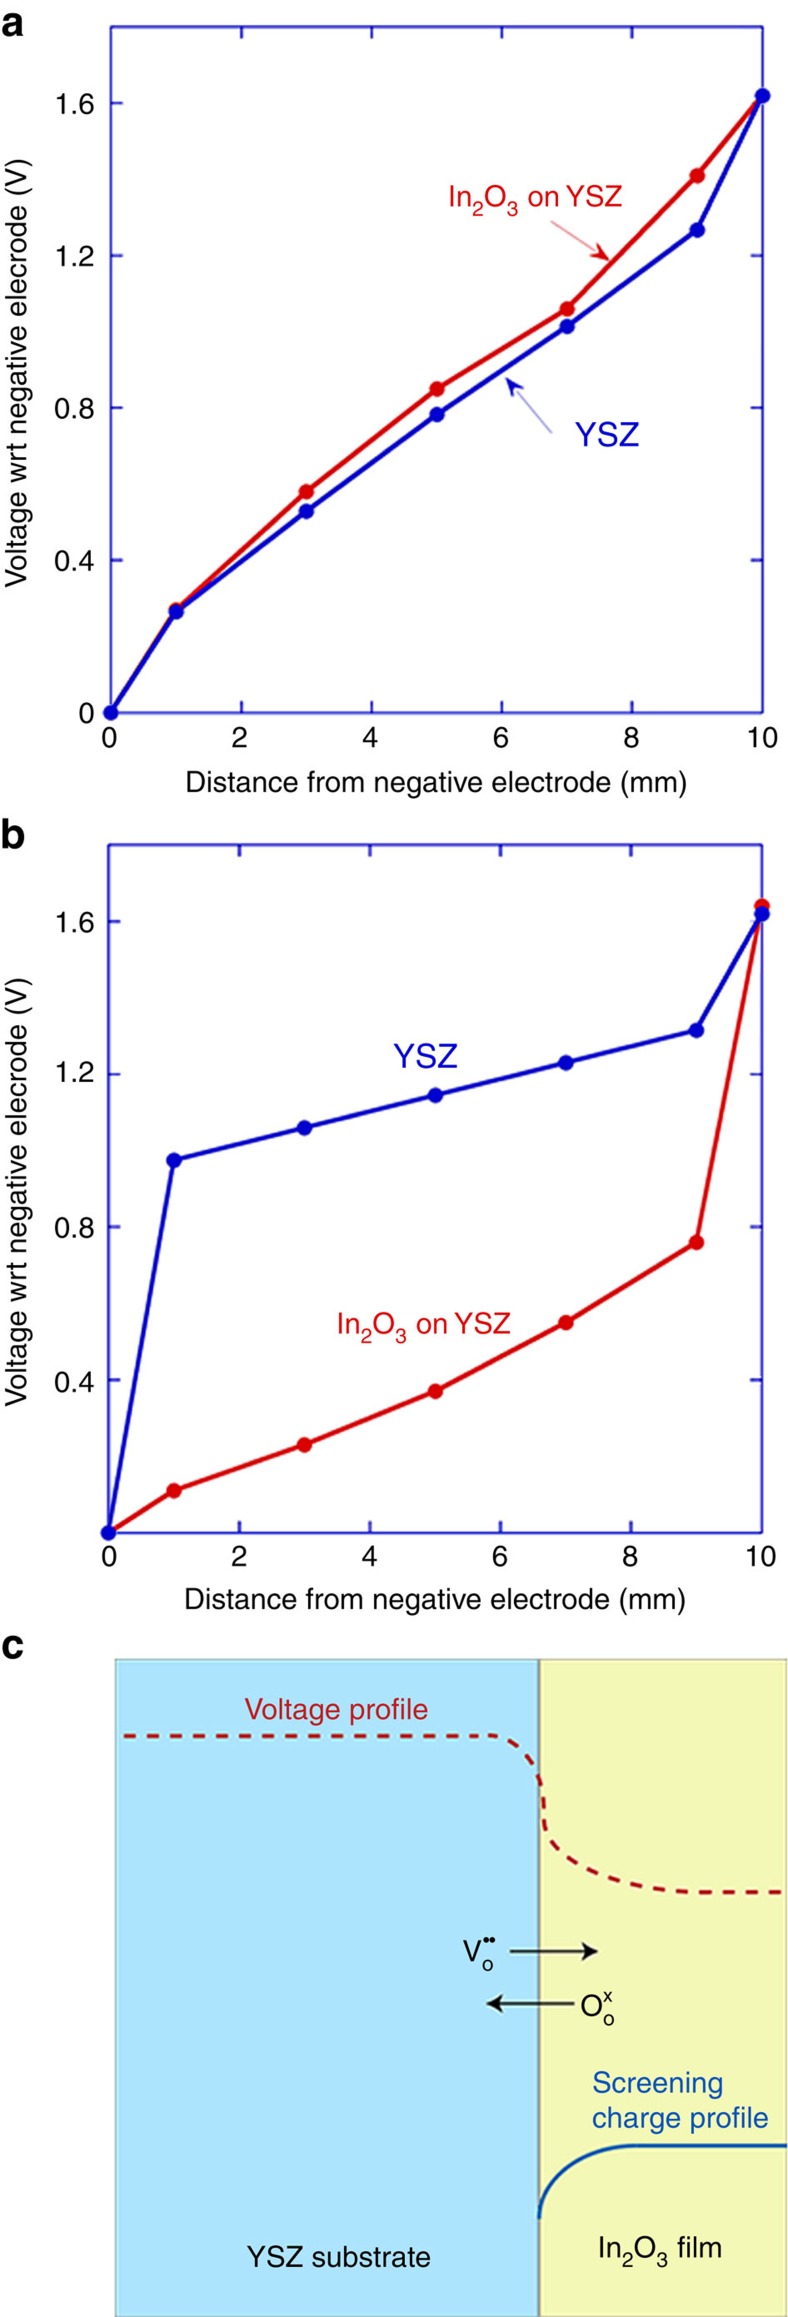
Figure 3. Voltage profiles.
(a) Initial voltage profile across a bare YSZ substrate compared with the profile across a 51 nm thick In2O3-on-YSZ sample when a 1.6 volt battery is connected to electrodes 1 and 7 at 330 °C (electrode configuration shown in Fig. 1). Minimal contact resistances are present initially. (b) The voltage profiles after 5 min (at steady state) for the same two samples. For the bare YSZ substrate, a large contact resistance has developed at the negative electrode (where oxygen entry occurs). A smaller contact resistance appears at the positive electrode (oxygen exit). A Schottky-type resistance appears at the positive electrode of the In2O3-on-YSZ sample. As a result of these resistances, a voltage drop develops between YSZ and the In2O3 film, with the substrate at a higher potential than the film. (c) The voltage profile that develops across the In2O3 /YSZ interface causes oxygen ions to move across the interface from In2O3 to YSZ. A screening charge appears in the In2O3 film near the interface. This interfacial electron doping increases the conductivity of the In2O3. In the YSZ, charge neutrality is maintained by mobile excess oxygen ions moving away from the interface.

