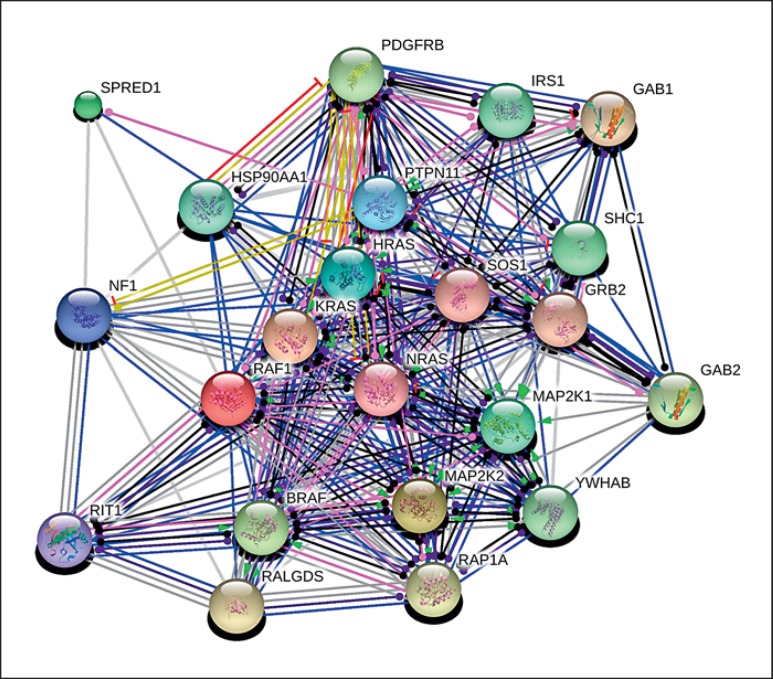
Fig. 5.
Interactions between 12 proteins associated with RASopathies (PTPN11, SOS1, RAF1, BRAF, KRAS, NRAS, HRAS, MAP2K1, MAP2K2, SPRED1, NF1, and RIT1) and 10 first neighbors in interactome (GRB2, GAB1, RALGDS, RAP1A, GAB2, PDGFRB, YWHAB, SHC1, IRS1, and HSO90AA1). The nodes represent proteins and the lines represent the relations between them. The colors of the lines and the arrows show different types of interactions among the proteins. For color legend see figure 4.

