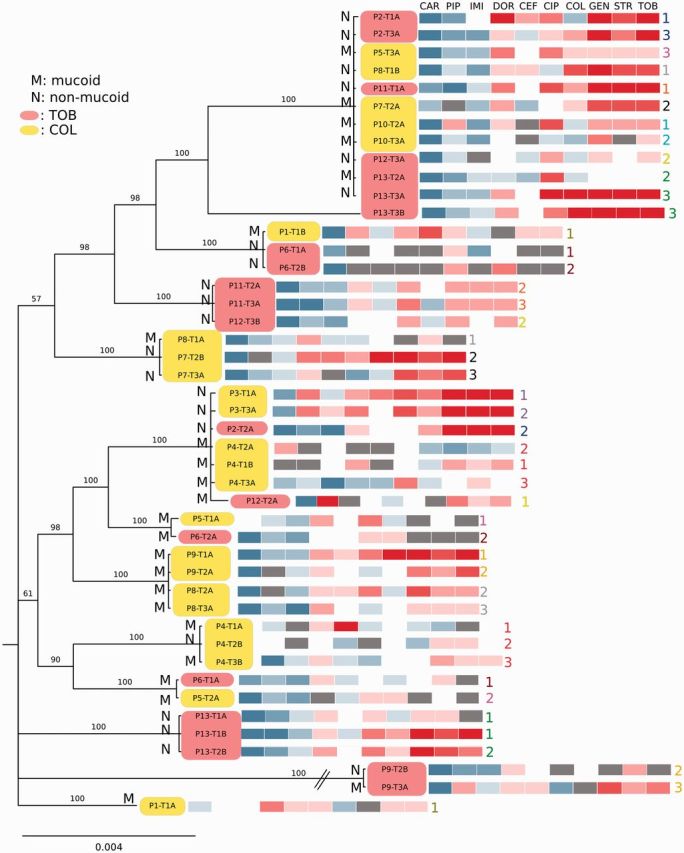
Figure 4.

Phylogenetic interrelationships among clinical isolates based on 13 MLST genes. Bayesian phylogram based on a GTR + Γ + I model of molecular evolution, 6 million generations of MCMCMC with 25% burn-in. Nodes are labeled with posterior probabilities. The phylogeny is annotated with the EUCAST E-test resistance profiles as in Fig. 1b. Yellow and magenta boxes indicate isolates from patients treated with colistin and tobramycin, respectively. M, mucoid; N, non-mucoid. Numbers in corresponding colours express order in which isolates were taken from the same patient at consecutive time points
